United Country – Three Decades After the Wall Came Down
Die Berliner Mauer als das Symbol der deutschen Teilung ist mittlerweile länger verschwunden als sie gestanden hat, doch die Unterschiede innerhalb des Landes sind auch nach drei Jahrzehnten noch sichtbar. Jüngste Forschungsergebnisse zeigen jedoch, dass die Bruchkante der wirtschaftlichen Entwicklung nicht immer ausschließlich entlang der ehemaligen innerdeutschen Grenze verläuft, sondern neben dem West-Ost-Gefälle auch Süd-Nord- oder Stadt-Land-Unterschiede zutage treten.
04. March 2019

The Berlin Wall as the symbolic embodiment of divided Germany has now been gone for longer than it ever existed. The third decade without this demarcation line drew to an end in 2019. Cold reality quickly replaced the euphoria after the fall of the Wall and reunification. The people in the east of Germany experienced the collapse of economic structures and the loss of millions of jobs. The political powers were faced with the challenge of promoting a rapid process of cohesion across the country, but without endangering the economic stability of united Germany or its role as a reliable partner in Europe and the world. With this in mind, it appears apt to ask what Germany, which completed reunification as a sovereign state just under one year after the fall of the Wall, looks like three decades later. This article explores the answers. It presents the findings of studies on the economic situation and the development of reunified Germany. In a first step, it illuminates Germany’s economic position within an international comparison. Then it casts an eye over the regional differences that prevail across the country in the third decade after the collapse the GDR.
How has Germany’s economic position changed in an international comparison since reunification? In Germany, per capita gross domestic product (measured in purchasing power parities) during the early nineties was, on average, approximately equivalent to that of all major advanced economies (Group of Seven – G7), and only the United States – by far the most prosperous member of the group – ranked higher. For a longer period afterwards though, per capita gross domestic product in Germany grew at a significantly more sluggish pace than the average within this set of countries. That was by no means inevitable. After all, growth rates in the East German economy were even quite high at the time due to the ongoing process of convergence. But reunification also brought burdens that curbed the growth trend in Germany. The public sector, for instance, gobbled up a considerably larger slice of the production potential. While in West Germany the public sector revenue ratio – relative to gross domestic product – was 43% prior to reunification, it had risen to 48% in reunified Germany by the mid-nineties. Compounding this trend was the significant slump in the country’s competitiveness in the early years of united Germany. This was caused by a stronger D-Mark (rising by 17% in nominal effective terms between 1989 and 1995) and domestic inflation caused by increased consumer spending after reunification. Moreover, the introduction of the D-Mark in former East Germany, the consequent conversion of wages at a 1:1 ratio and the following, considerable increase in wages inevitably eroded Germany’s competitiveness. It is worth noting that the degree of openness in the German economy as the ratio of total exports and imports relative to gross domestic product slumped considerably in the years following reunification. This observation was by no means inevitable, either. After all, the surge in demand precipitated by reunification and the competitiveness deficit among German companies could just as easily have led to a rise in imports as well. But imports grew at a moderate rate in the first half of the nineties, and demand in the east was mainly satisfied by supply from the west of Germany. The domestic market became increasingly important to West German companies, while the significance of exports dropped significantly, initially at least. The current account balance flipped suddenly into the red.
But the German economy has recovered from its weak phase in the middle of the last decade and per capita production has tended to grow at least as quickly as the average of other G7 states. The labour market reforms of 2003 to 2005 are frequently cited as reasons for this turnaround. However, it was the resurgent export market that mainly strengthened the German economy, a trend that had set in at the end of the nineties.
Many companies succeeded in increasing their labour productivity by outsourcing unproductive value chains abroad. Besides, the manufacturers of capital goods which are eminently important for Germany benefit as a result of increased demand for these products on fast-growing emerging markets, most notably China. Ultimately, therefore, the collapse of the Iron Curtain promoted internationalisation of the German economy to a particular extent, and the degree of openness, relative to the size of the country, is now remarkably high.
Are the 30 years of united Germany a success story from an international perspective? The answer depends on the scale: the German economy was, when all’s said and done, able to assert its position within the group of major industrialised nations, but the gap to the United States has nevertheless widened. The reason for the faster improvements in US-American productivity is, to a significant degree, explained by the strength of the country’s digital economy. To a large extent, the digital economy did not emerge until after German reunification. The German word “Handy” (for mobile telephone) did not enter common parlance until 1990, and the US-American National Science Foundation first made the Internet available outside of universities in the same year. Technical progress in the IT sector remains driven significantly by the United States, and the world’s five most valuable companies in 2017 all maintained a digital business model and were domiciled in the US. Narrowing the gap in the digital economy will be tricky. But it is worth considering the general issue of why the conditions for the emergence of new technologies were and remain seemingly more favourable across the Big Pond than here in Germany, as well as what can be done to remedy the situation. In doing so, it is essential to remember that Germany’s unusually high current account surplus does not have its roots in outstanding competitiveness, but expresses instead a reluctance among investors to put boots on the ground in Germany.
Following this description of Germany’s economic position in an international comparison, the next section will turn its attention to the economic situation in the reunified country. Defined in economic terms, the disappearance of the Berlin Wall and the establishment of a united Germany were a case of economic integration. Once the border was opened, residents of former East Germany were allowed to choose freely where they wanted to live and work. With the introduction of the currency, economic and social union in mid-1990, east Germany became part of a wider region of European integration, in which there were no restrictions on the freedom of movement for production factors. There was a general assumption that the significant differences in regional development would gradually converge over time. At the time, the gap between west and east dominated the perceptions of territorial disparities in Germany. But that was hardly surprising. Four decades of German separation would inevitably leave traces.
The German economy has overcome a period of weakness following reunification
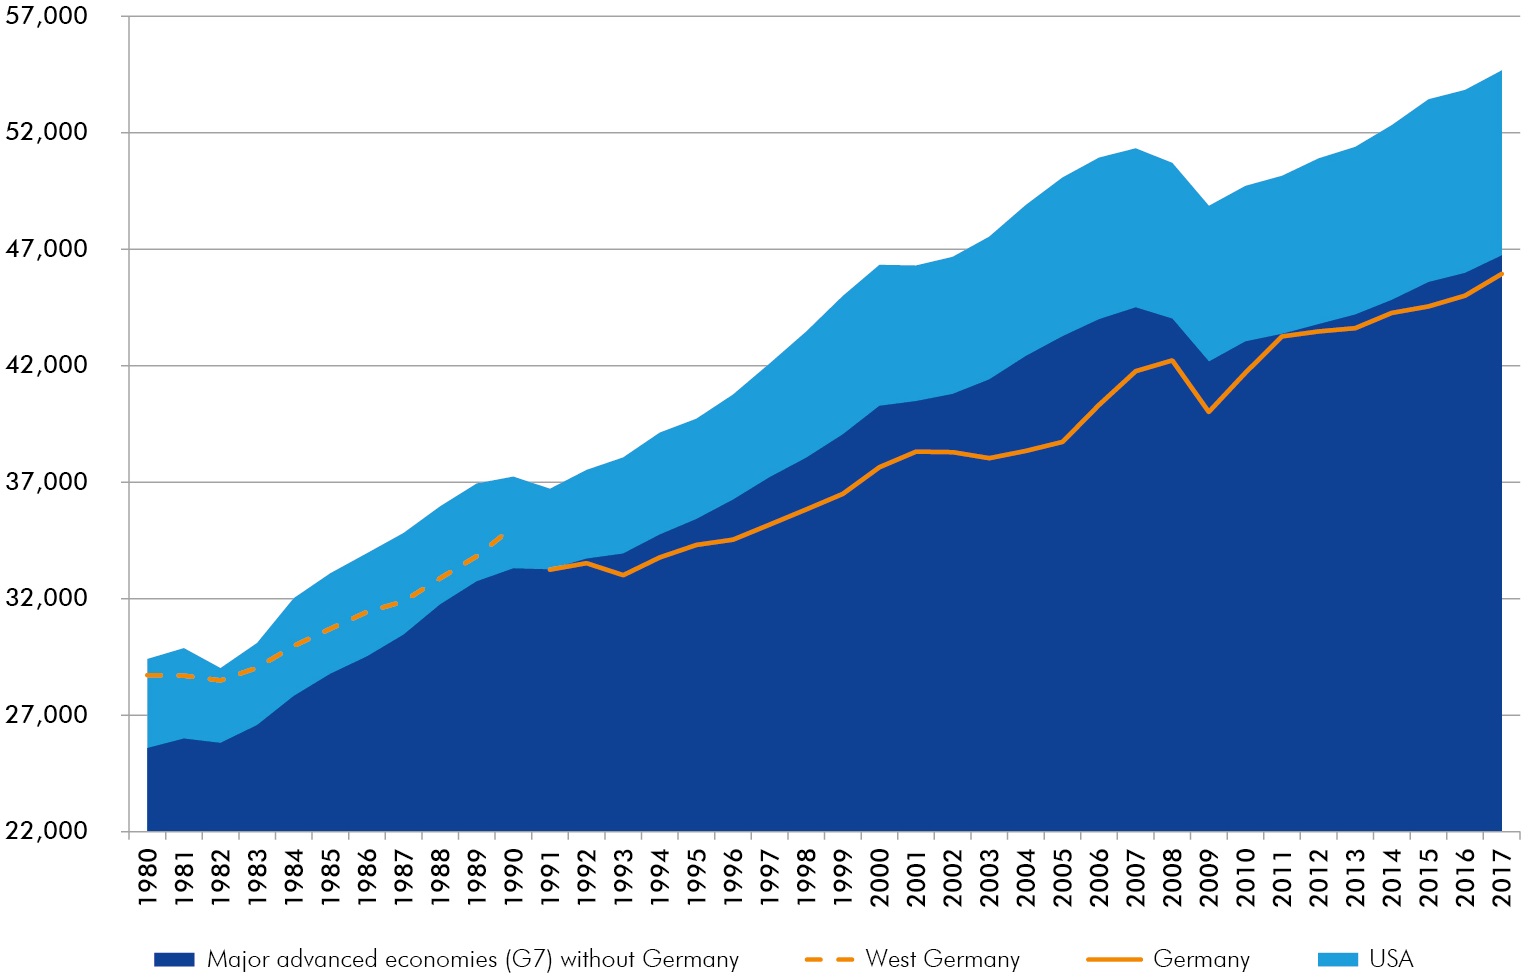
Gross domestic product per capita, purchasing power parity, 2011, international dollar
Degree of openness of the German economy
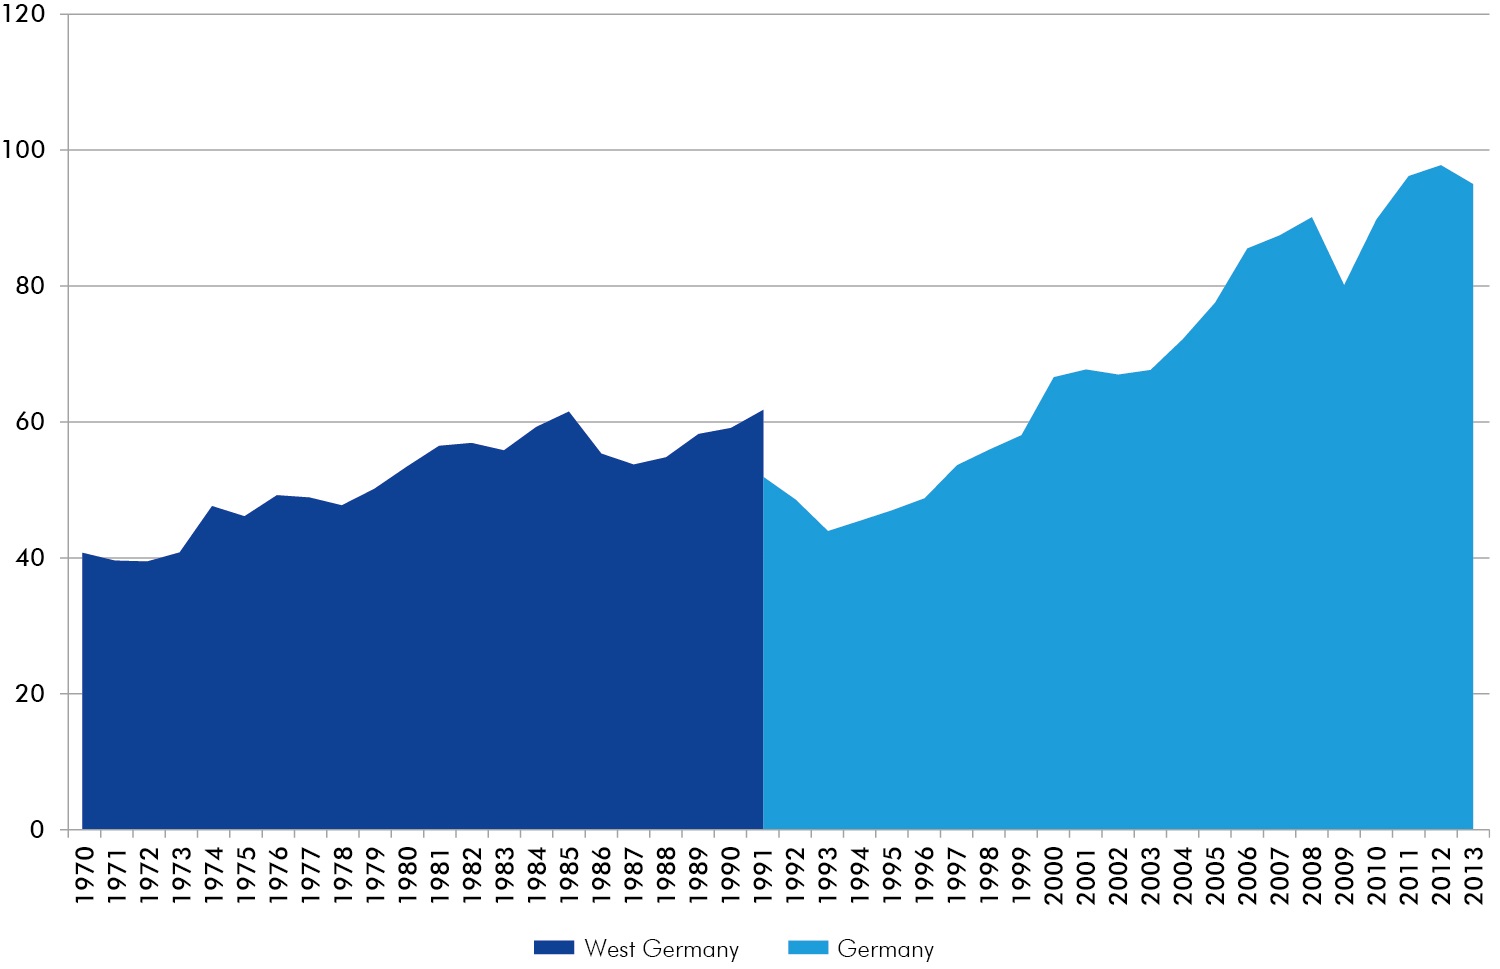
(Exports + imports)/gross domestic product, in %
Current account balance
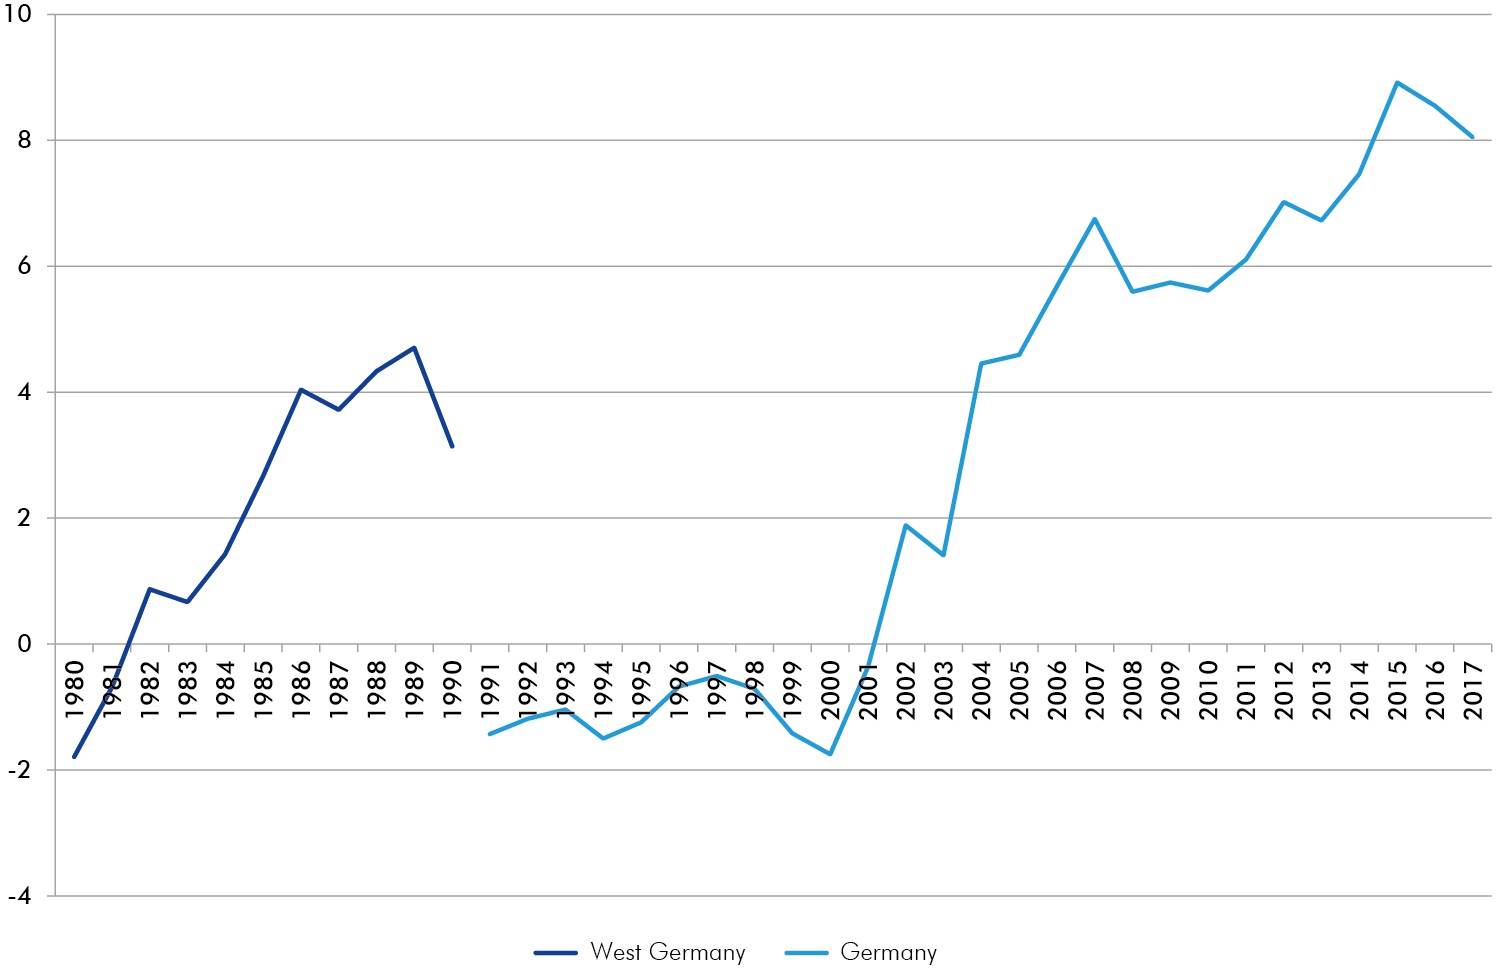
Relative to gross domestic product, in %
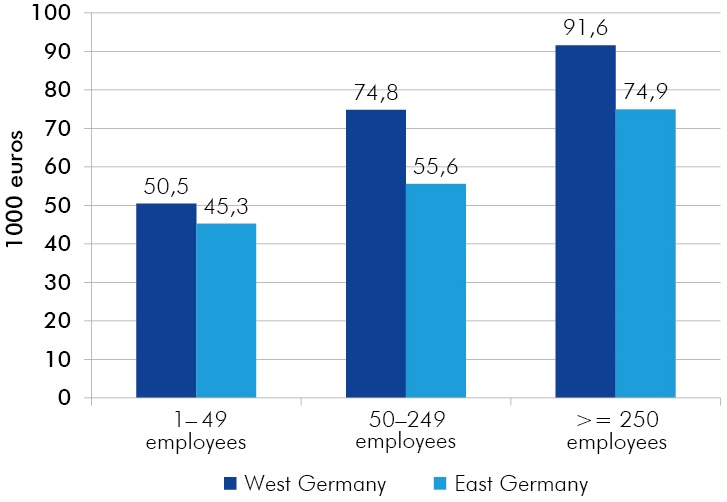
Productivity differences in Germany between west and east
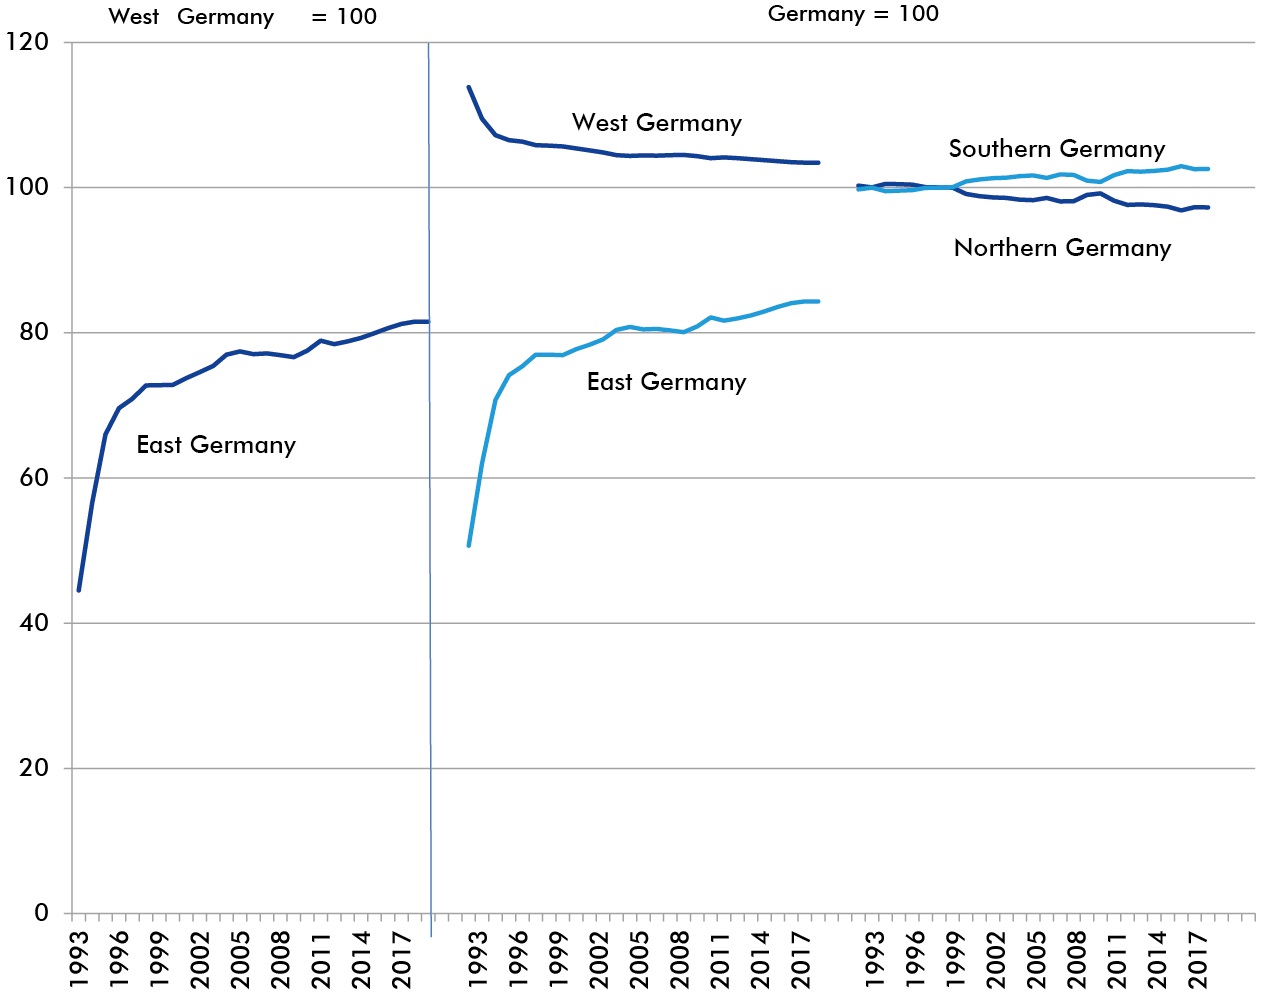
Gross domestic product in current prices per employee
East-west differences in productivity in companies of all sizes
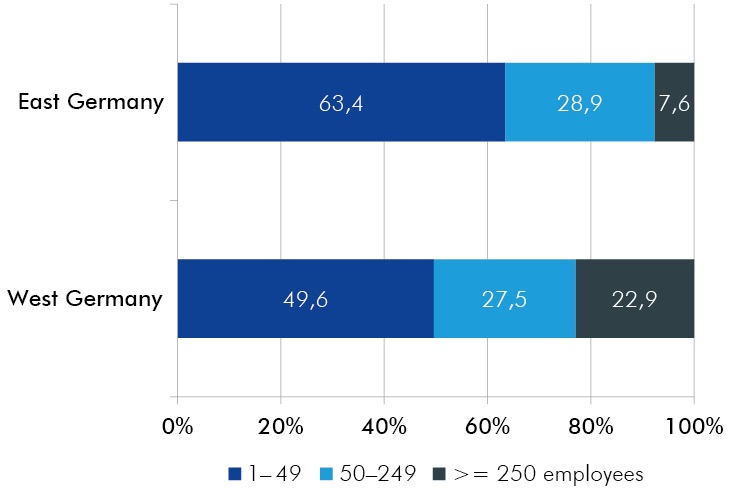
East-west differences in productivity in companies of all sizes
Hardly any corporate HQs in East Germany
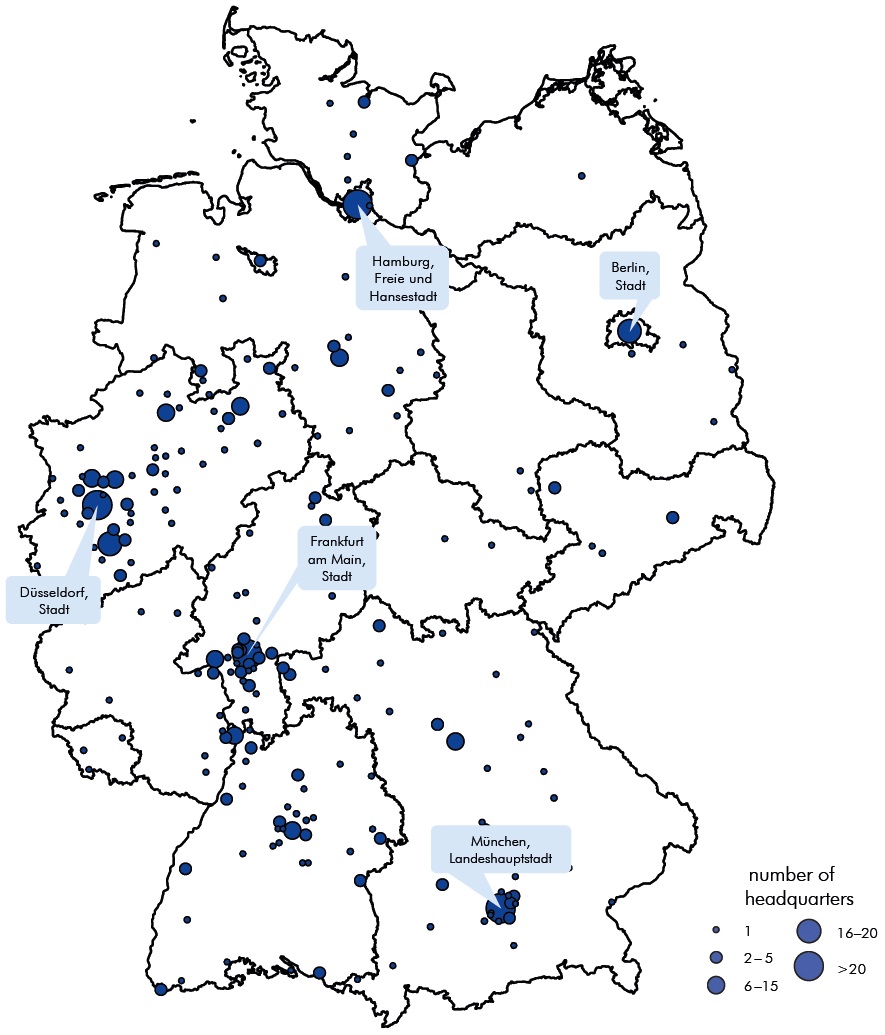
Headquarters of the TOP 500 companies in Germany 2016 ranked by DIE WELT
East-west productivity differences are smaller in rural areas than in cities
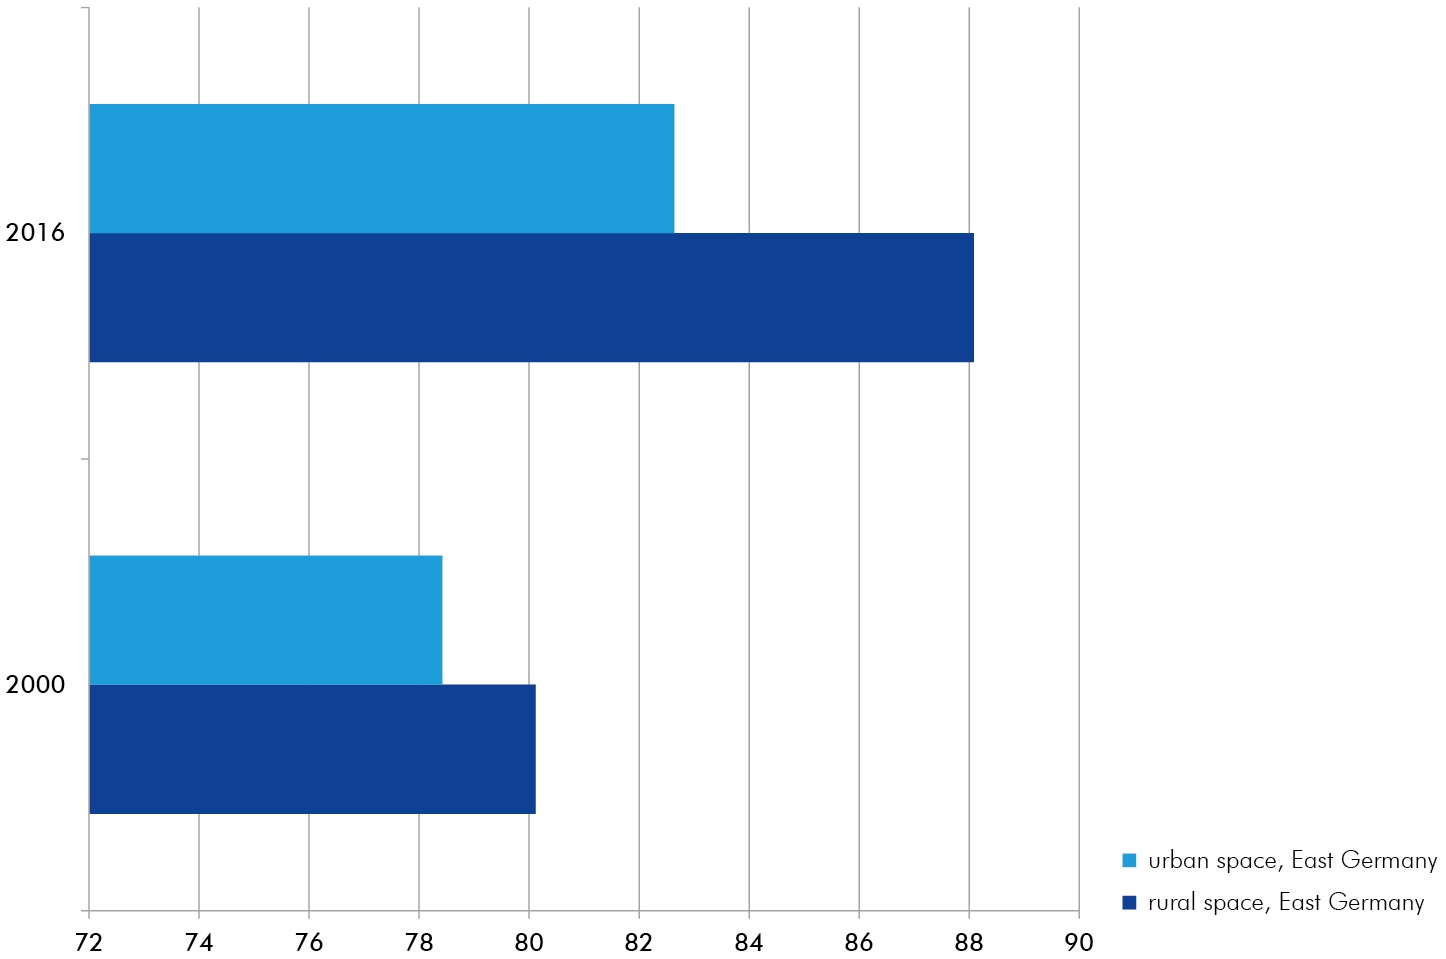
Gross domestic product per employee in urban and rural spaces in East Germany including Berlin, spatial category in West Germany = 100
Economic output per resident in German regions compared to European regions
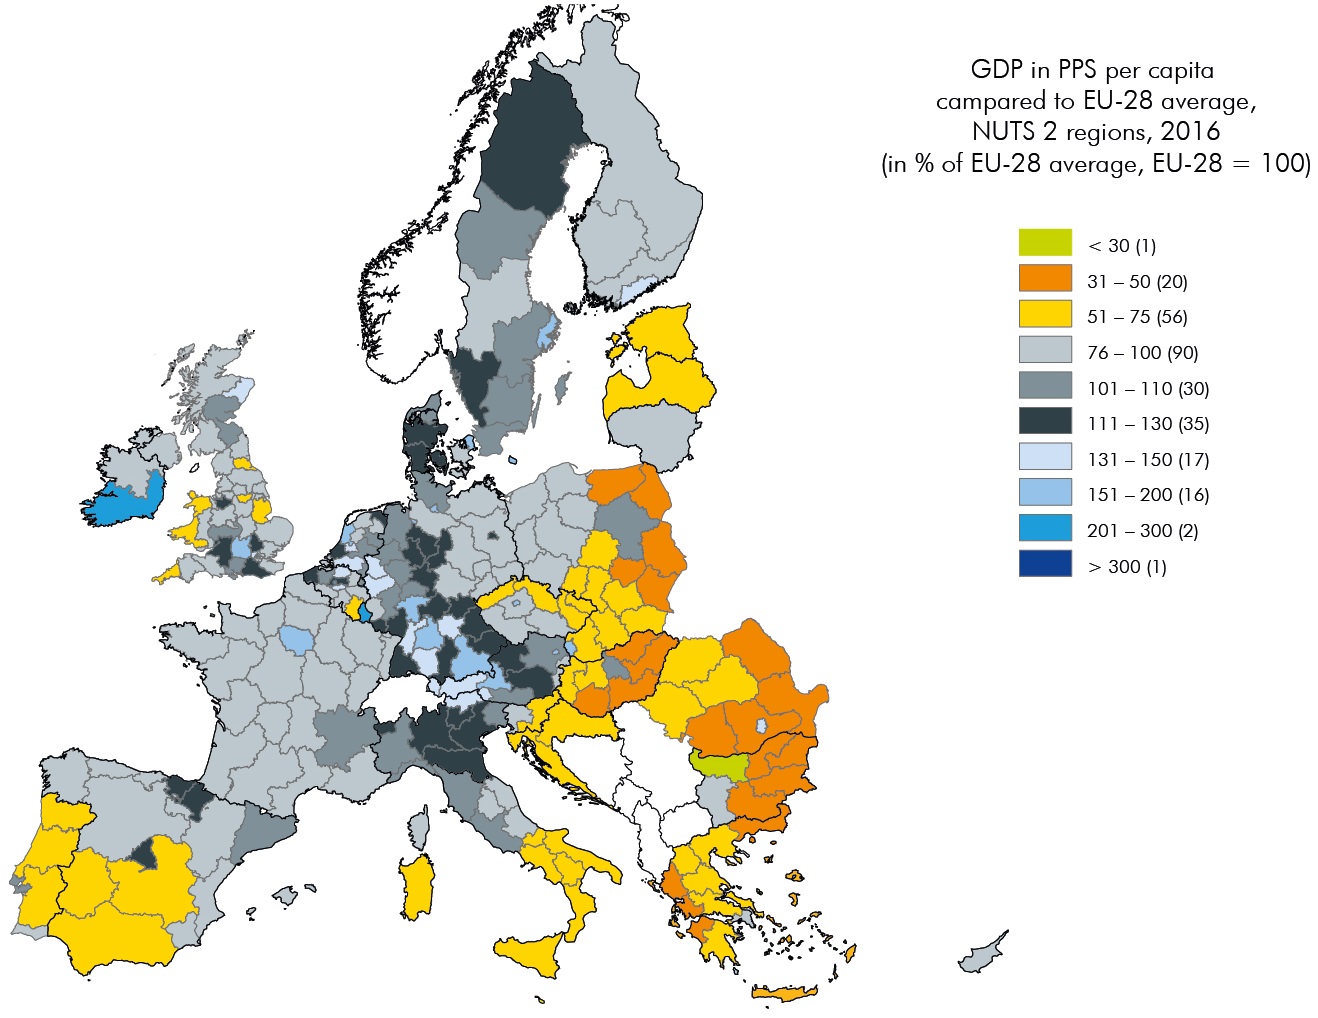
Gross domestic product (GDP) in purchasing power parities (PPS) per capita 2016
Economic output per capita in East Germany higher than in the Visegrád countries
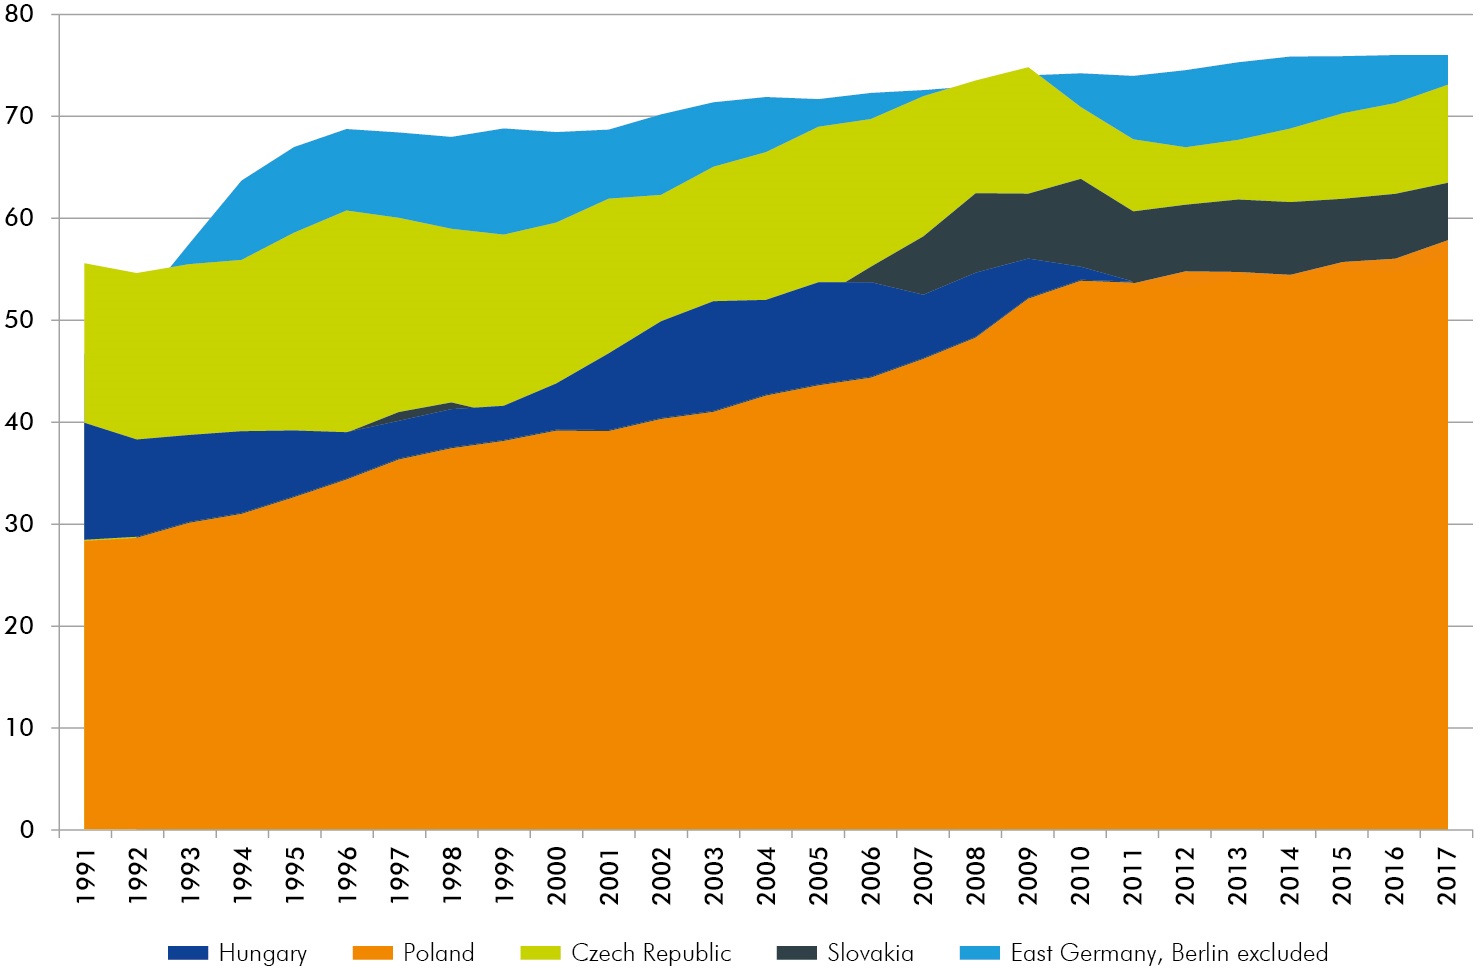
Gross domestic product per capita in purchasing power parities relative to Germany, in %
Germany‘s regional income disparity has lessened compared to other European regions
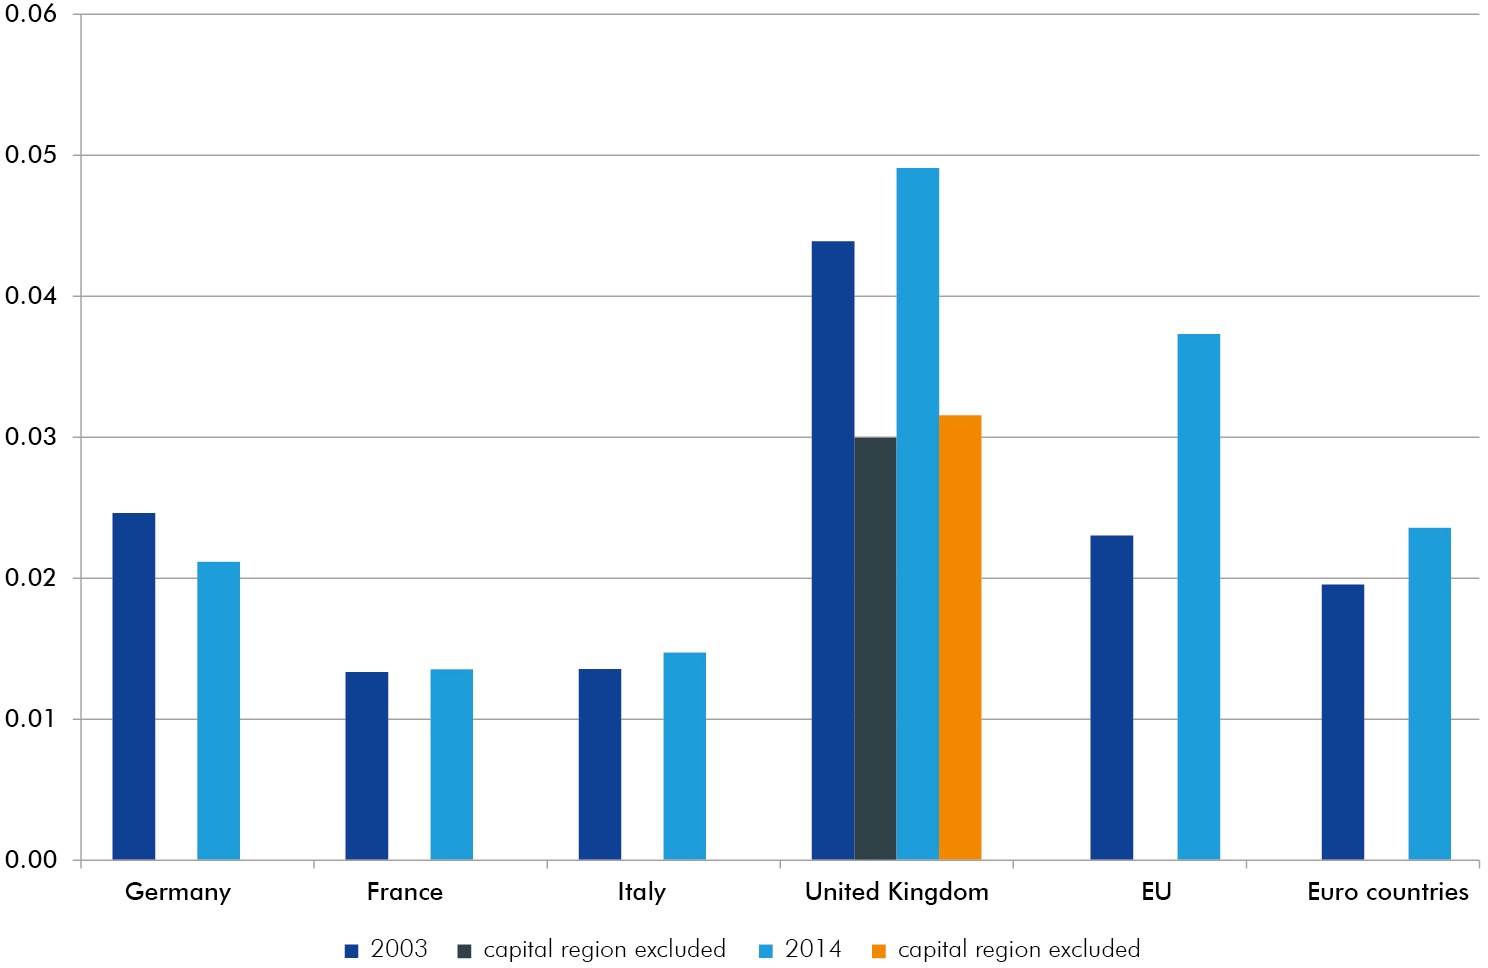
Variance of gross domestic product, lograrithmised, purchasing power parities
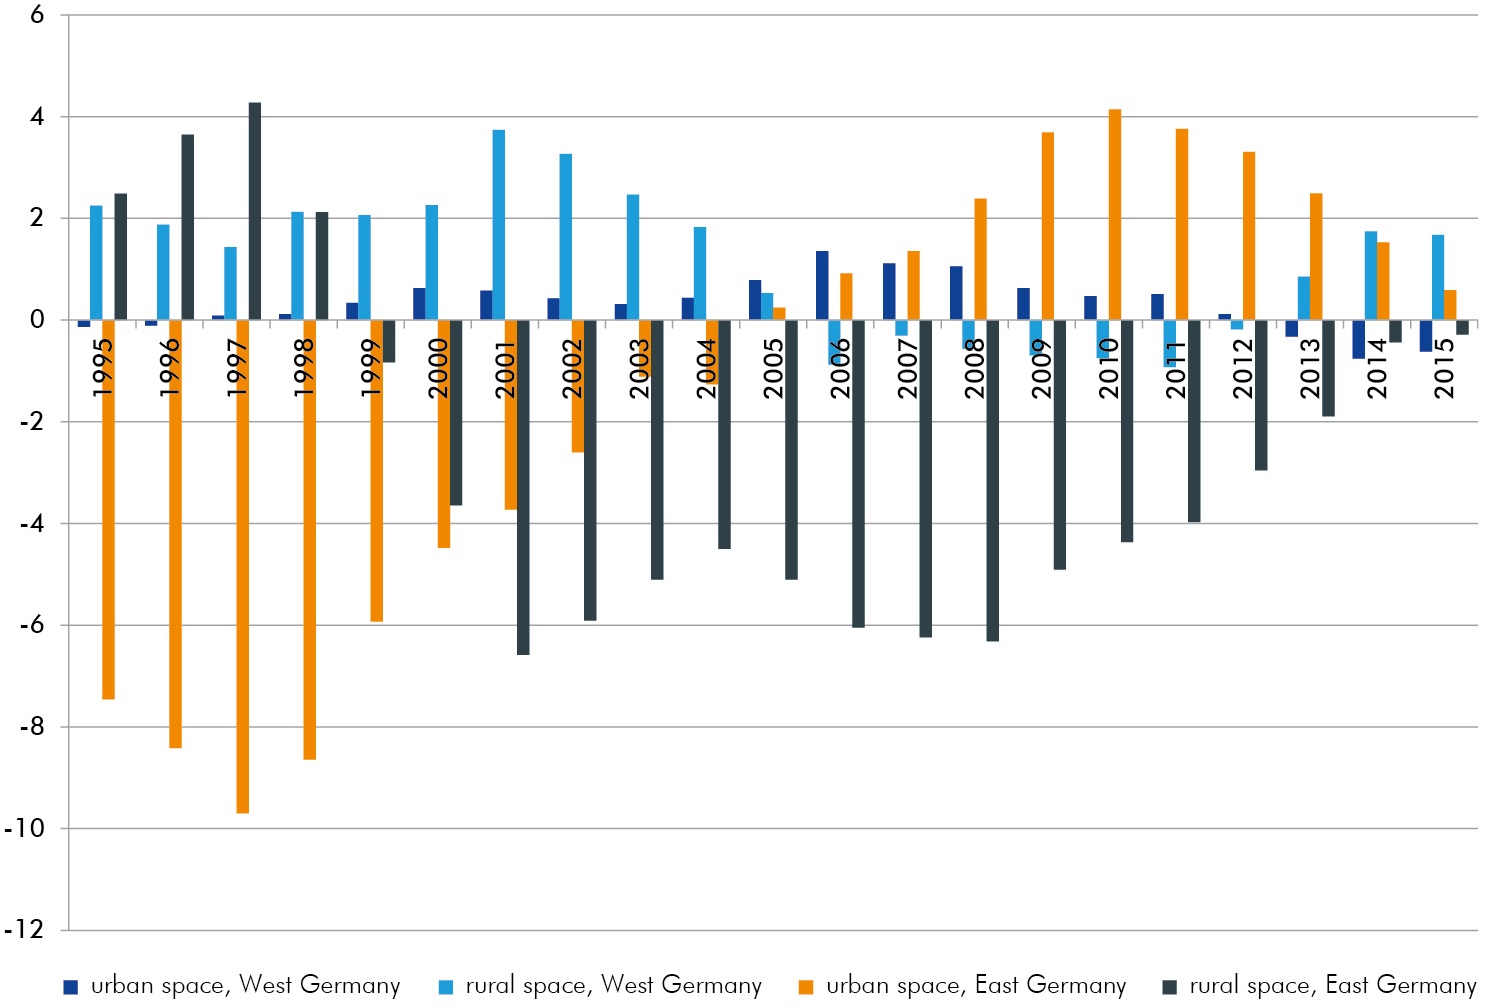
East Germany has only recorded a more favourable development of economic output than West Germany in 11 out of 26 years
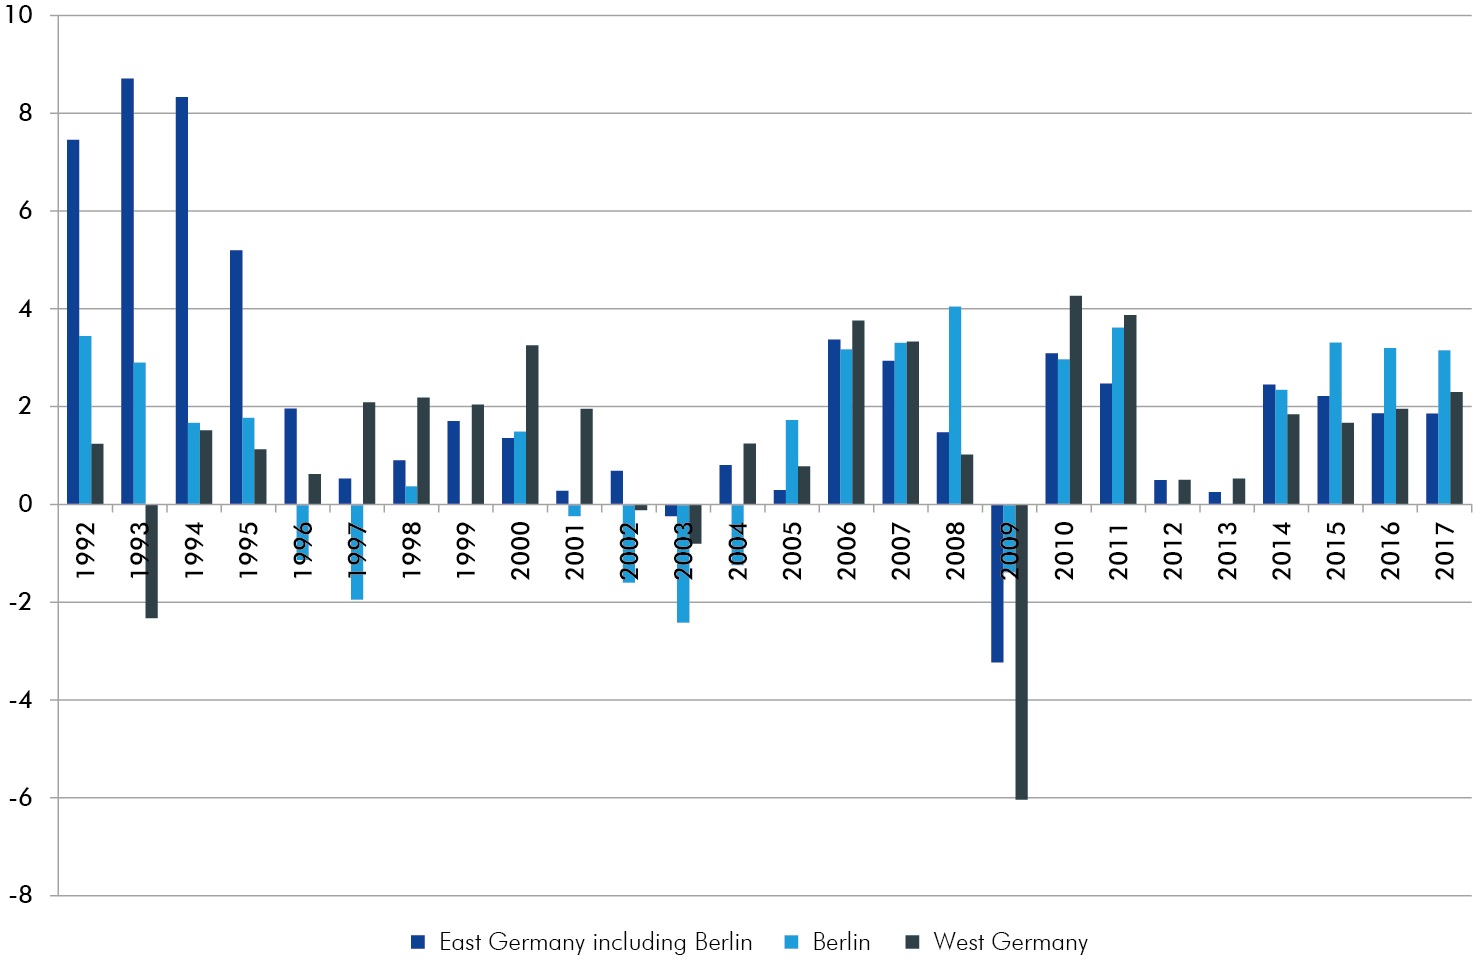
Yearly rate of change of gross domestic product, price-adjusted, chain-linked, in %
Average wage: clear east-west divide in salaries
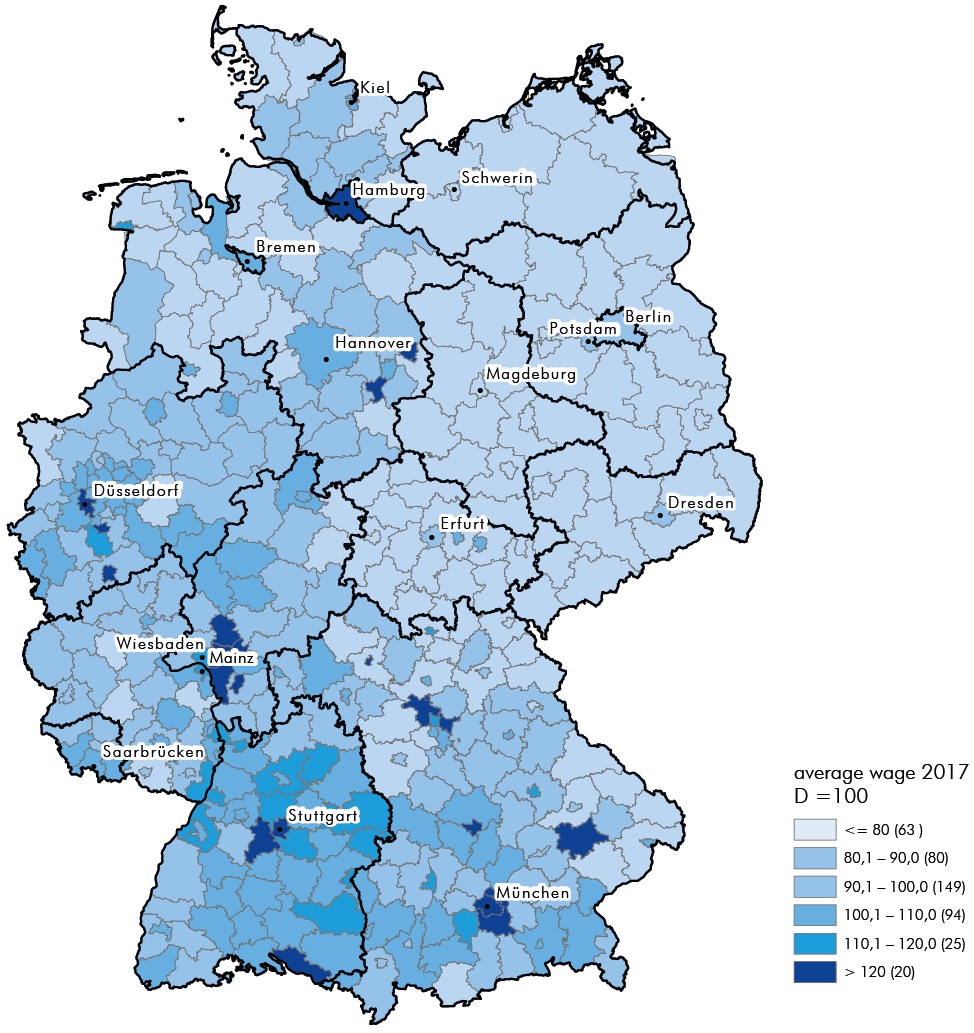
Median of monthly gross wages of full-time employees liable to the social insurance system; Germany = 100, 31.12.2017
Services are the main source of added value and employment
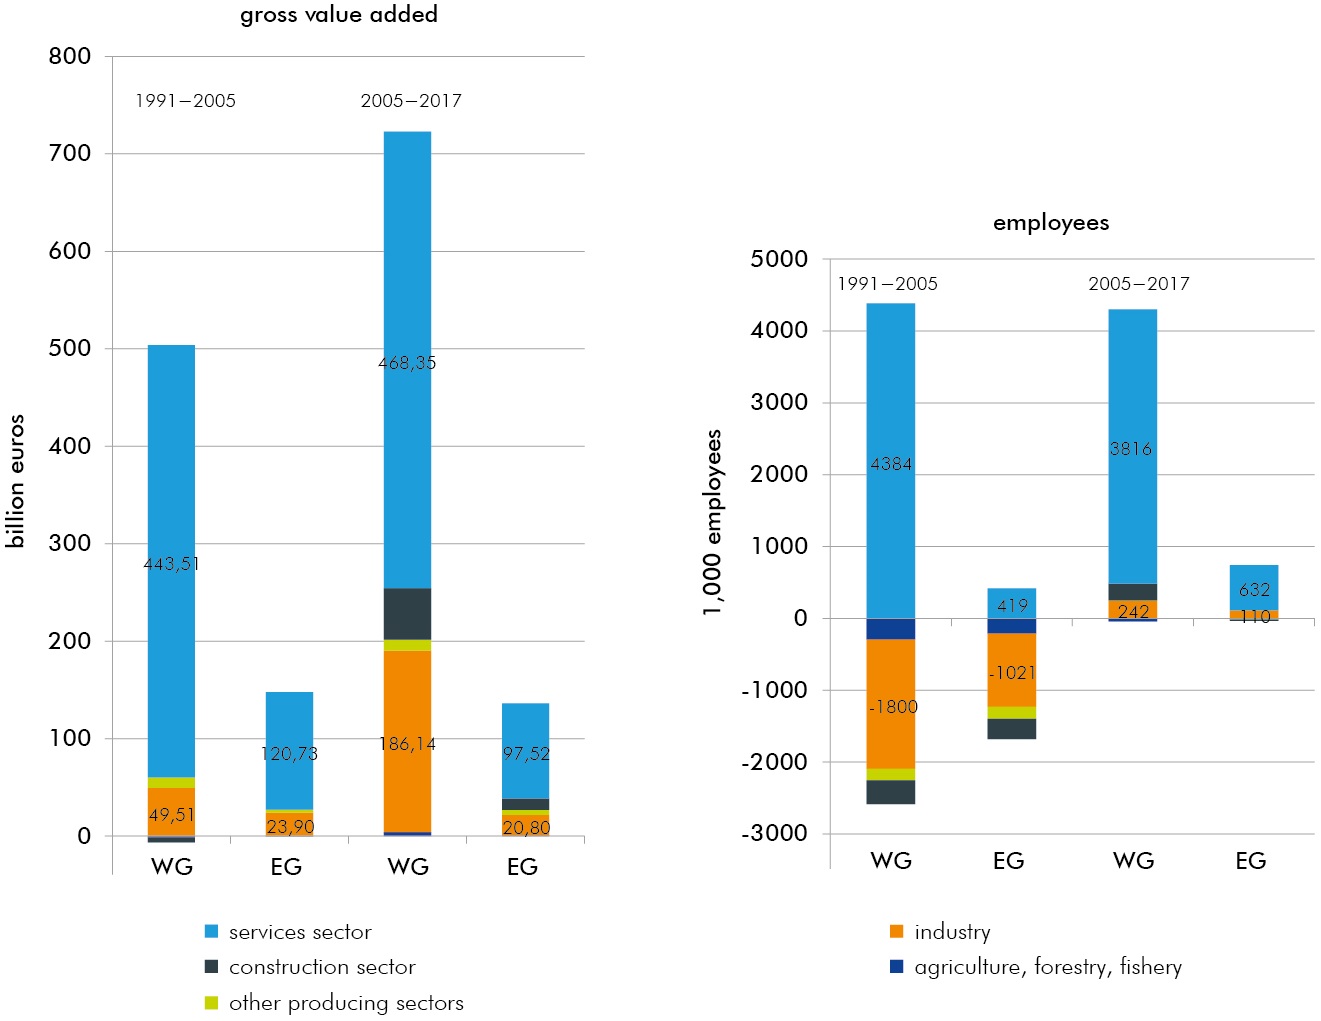
Absolute change in gross value added in current prices and in employment by industries
Underemployment rates: large regional differences
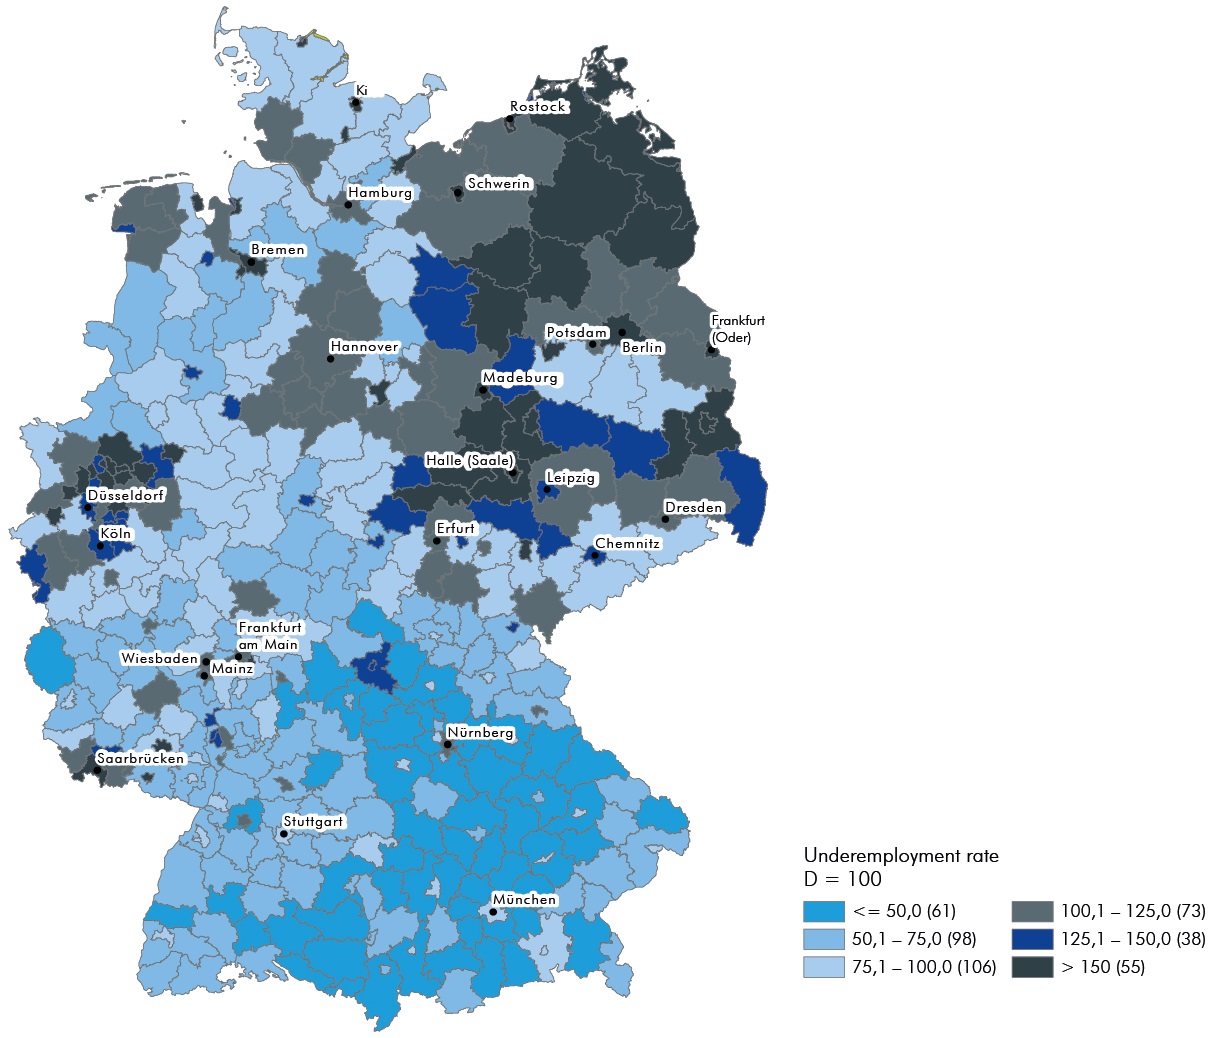
Underemployment quota in Germany = 100, 2017
Lack of capital of no significance for East Germany‘s productivity shortfall
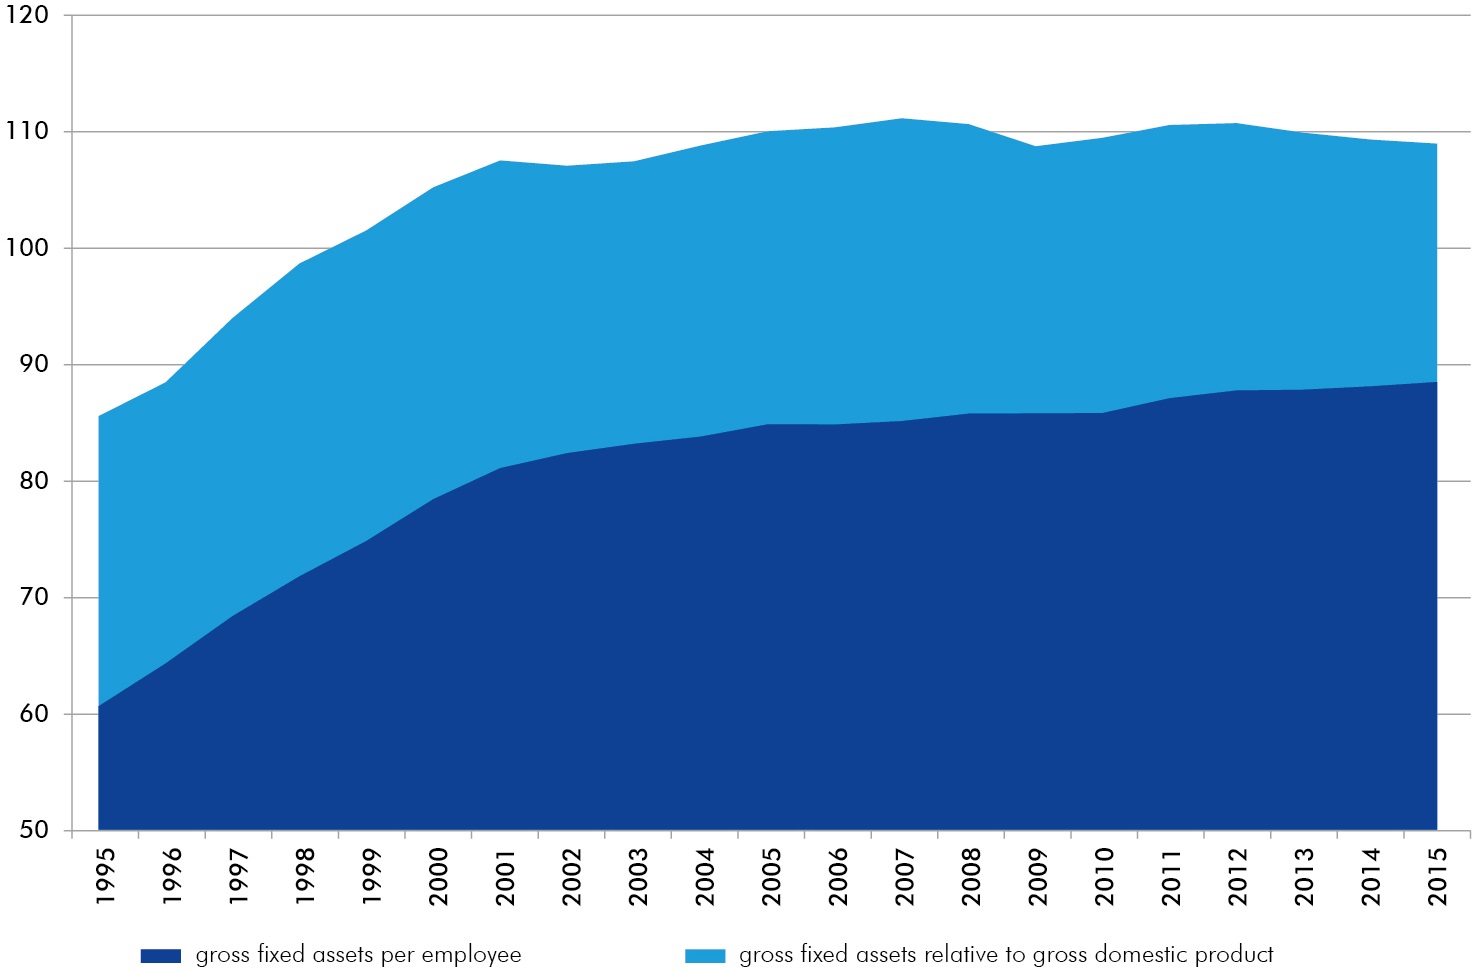
Gross fixed assets at replacement costs in East Germany including Berlin relative to West Germany, in %
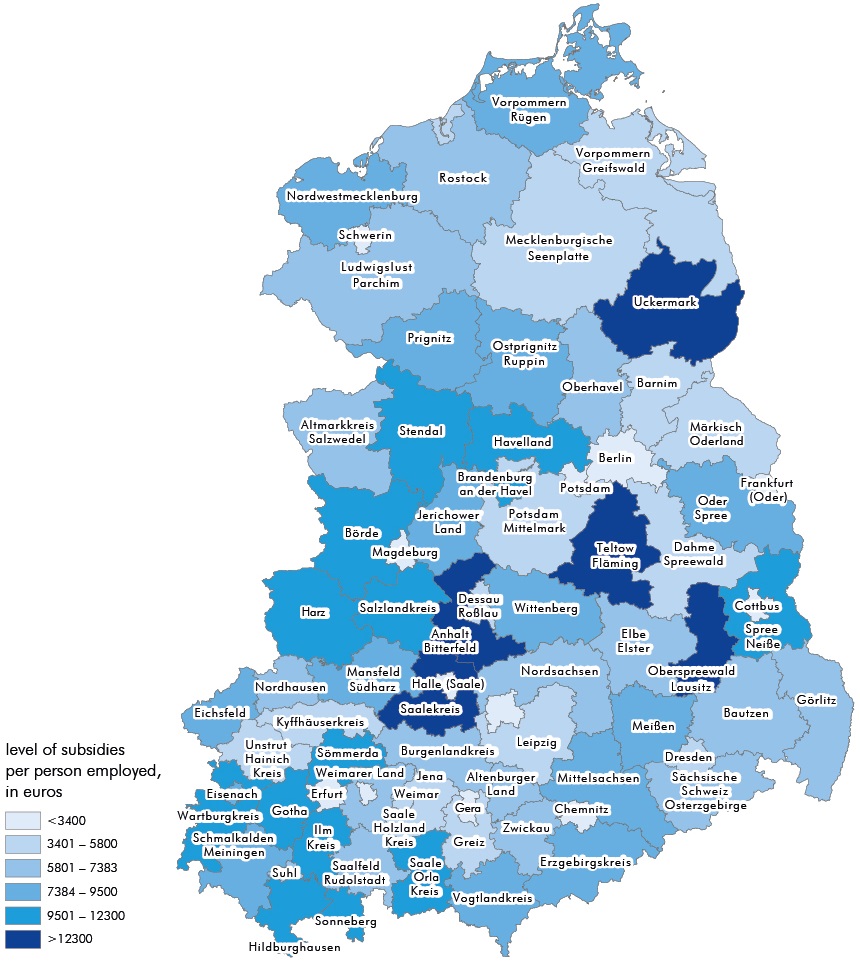
In East Germany, rural regions gained aboveaverage benefit from regional aid – but the period of generous subsidies is over
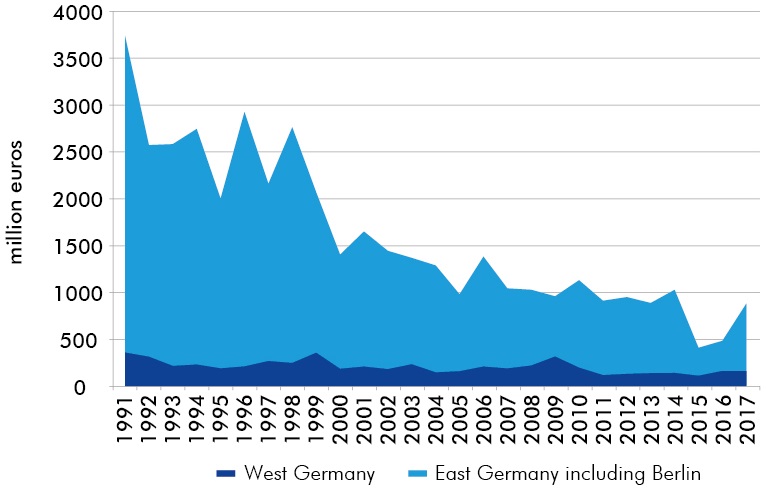
Investment grants to commercial businesses from 1991 to 2017
In East Germany, rural regions gained aboveaverage benefit from regional aid – but the period of generous subsidies is over
Investment grants to commercial businesses from 1991 to 2017
East-west migration: net emigration comes to a halt
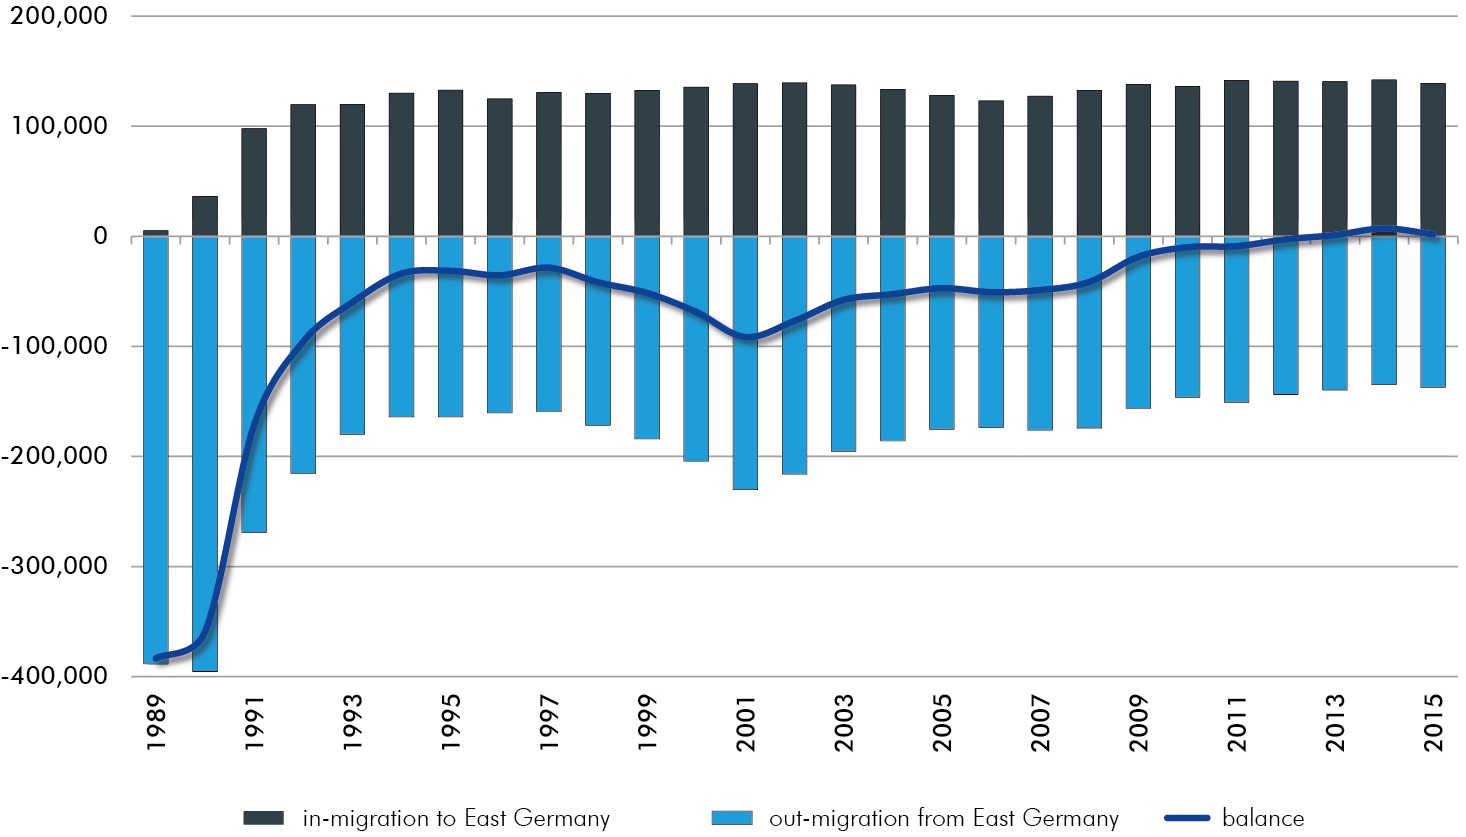
Out-migration from East Germany to West Germany, in-migration to East Germany from West Germany, migration balance, from 1989 to 2015
Population development in East Germany: an increase from 2013 onwards as a result of overseas migration gains
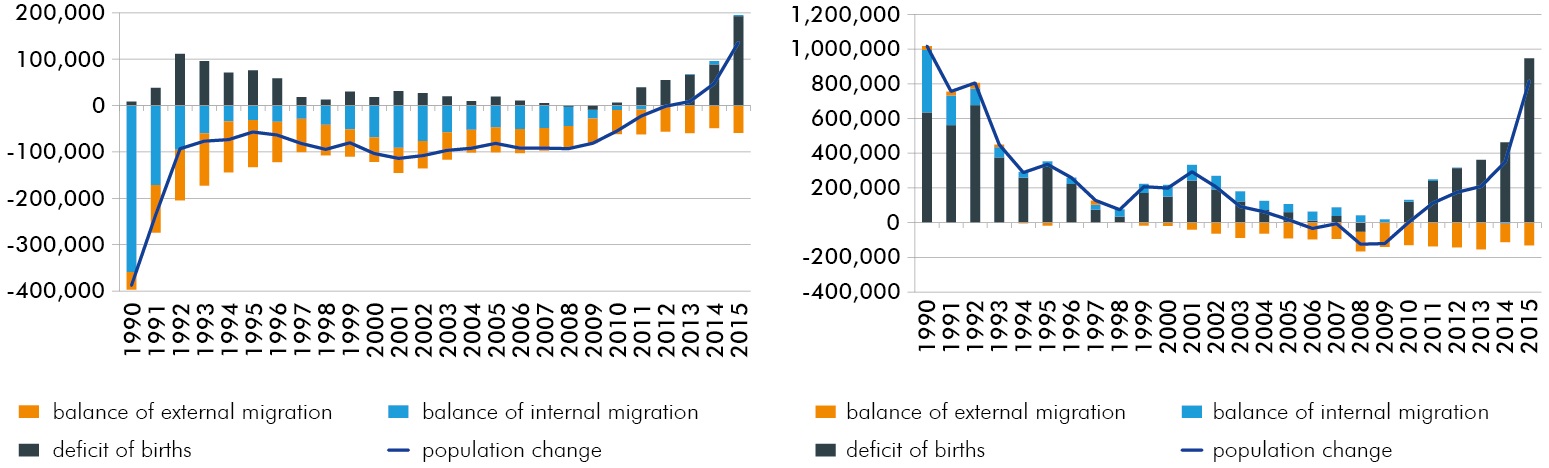
Population development in East and West Germany in the period from 1990 to 2015 by components, yearly population change (number of persons)
Internal migration: the population of rural areas in East Germany has continuously declined since 1999
Balance of internal migration per 1,000 inhabitants
Decline in working-age population in East German territorial areas until 2060 more than twice as big as in West Germany
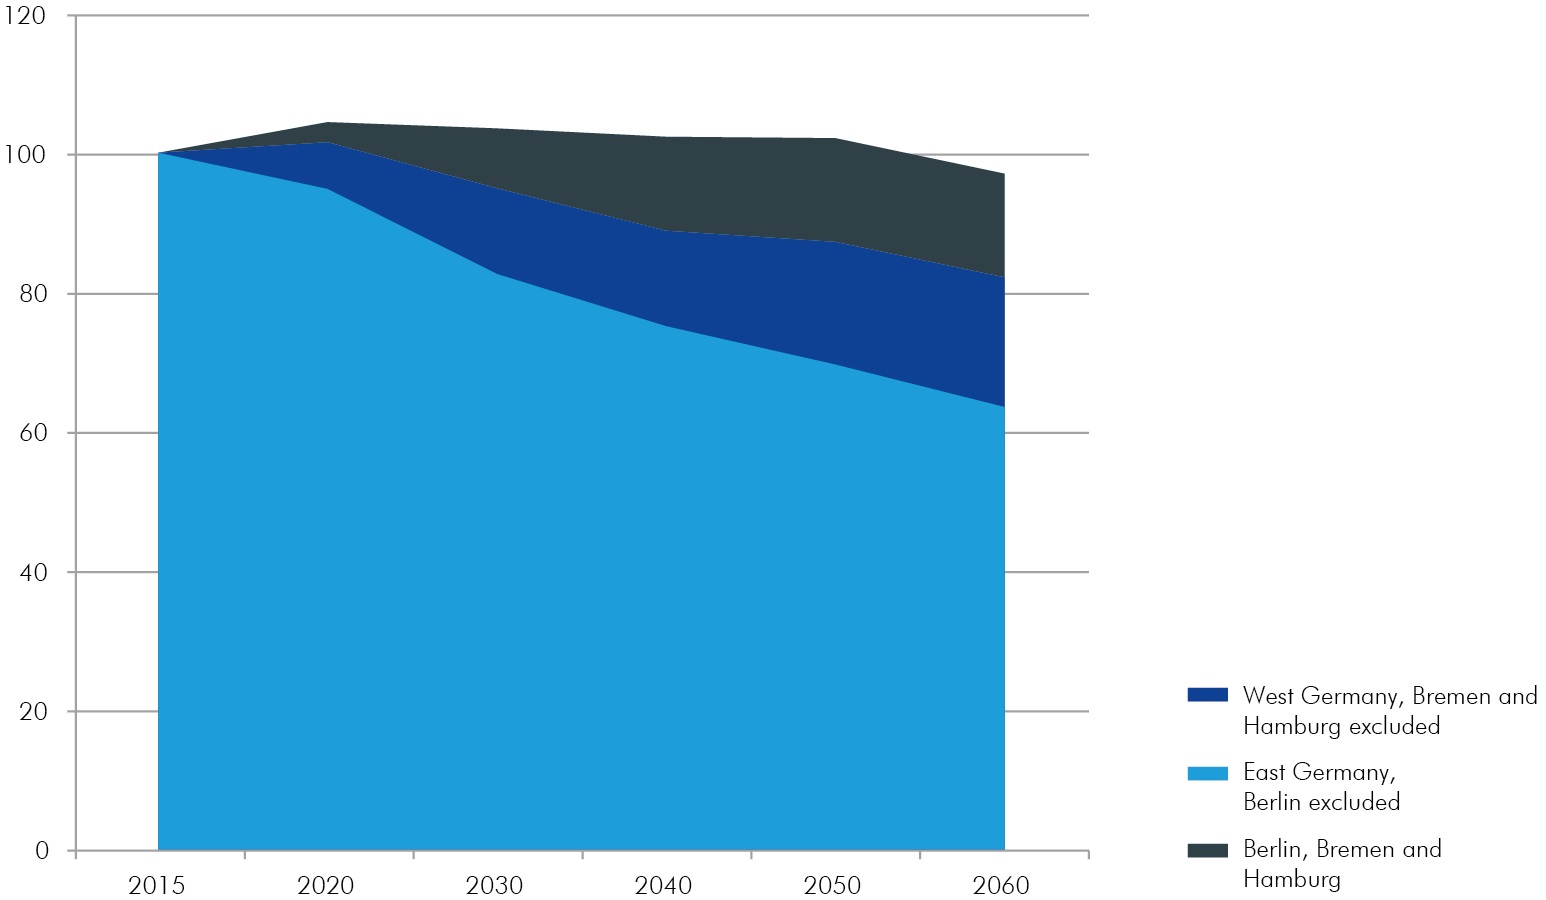
Index of development of population at employable age (20 up to below 67 years) based on the updated 13. coordinated population projection by the Federal Statistical Office, year 2015 = 100
Migration gains from the EU: significantly lower in East Germany than in West Germany
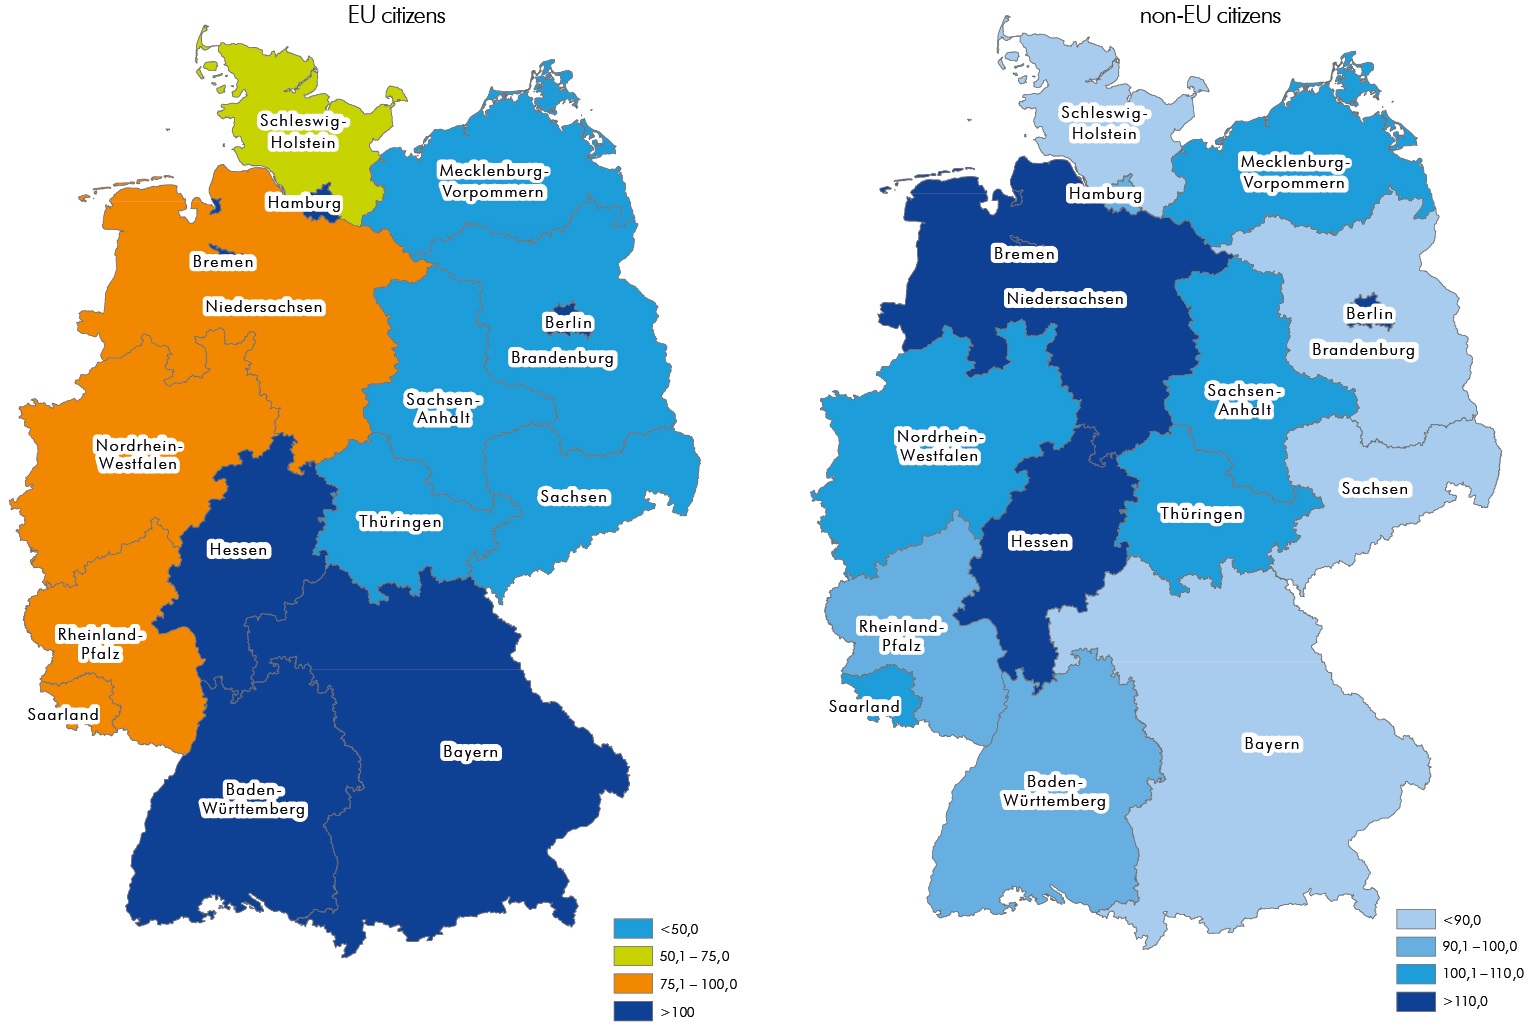
Cumulative net migration gain per 1,000 inhabitants, Germany = 100
EU blue card: Berlin has a clear lead
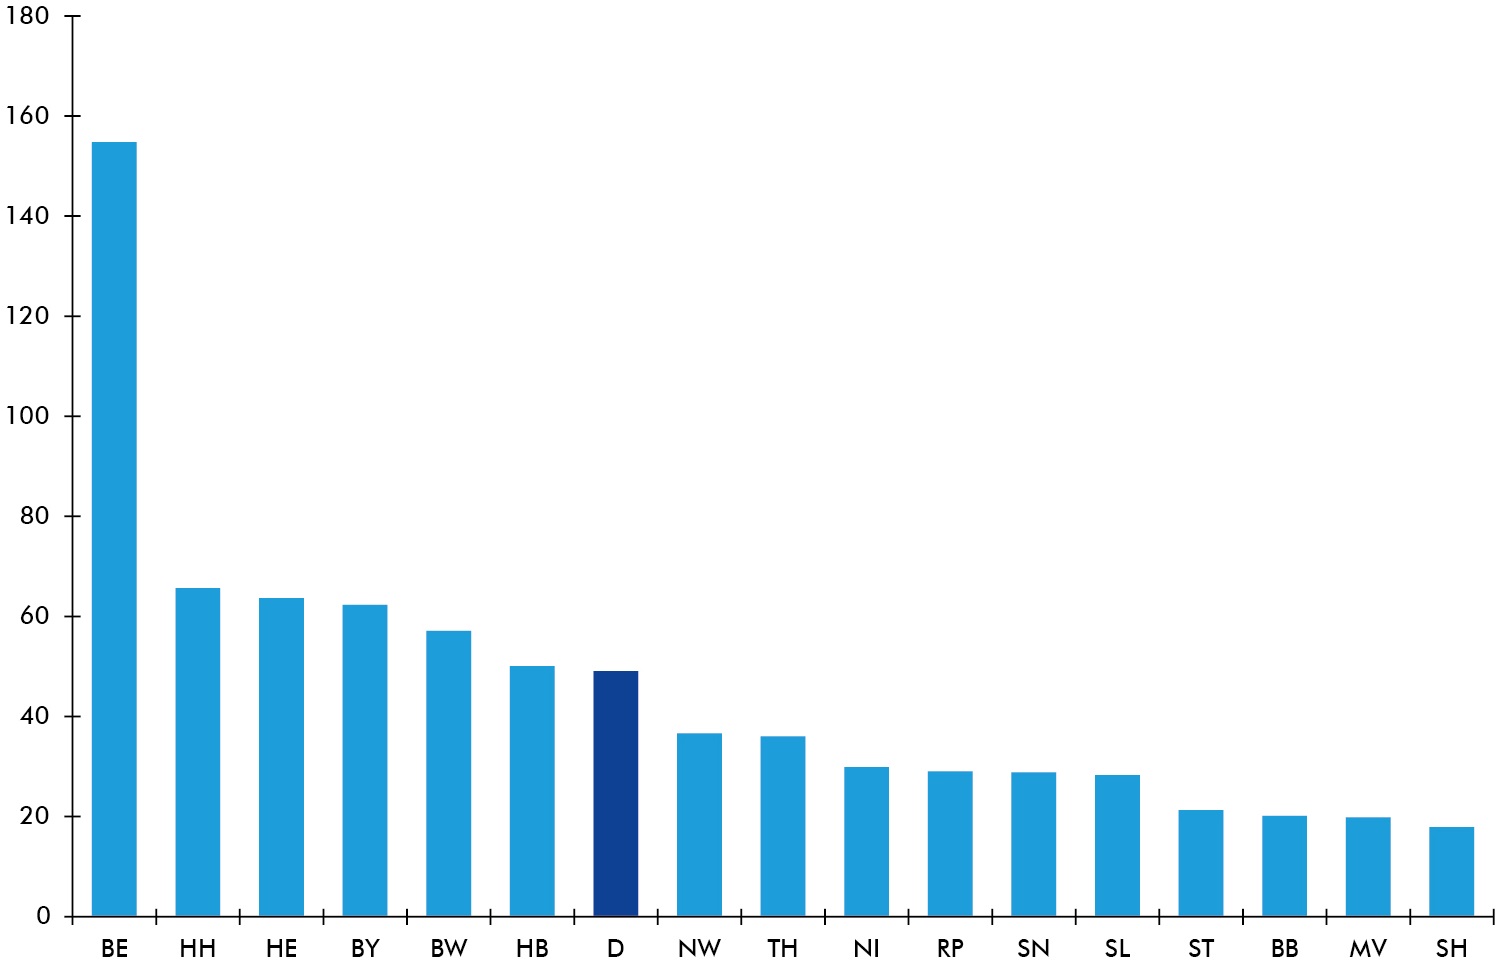
Blue card recipients per 100,000 employees in the federal states in 2017
Proportion of people with a migrant background in East Germany and rural regions well below the federal average
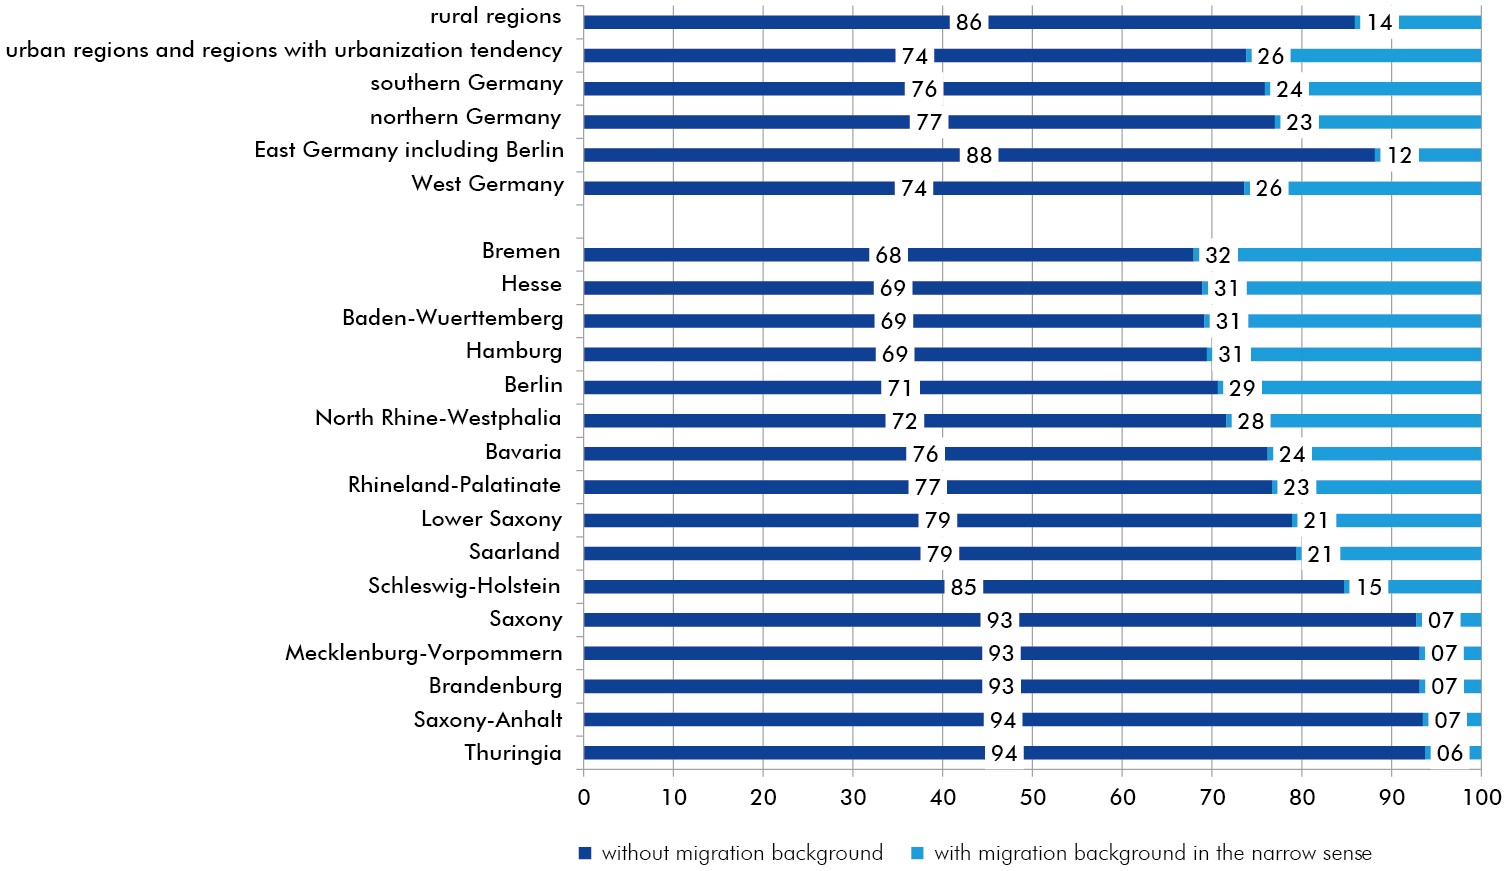
Share of population without and with migration background in 2017 in % (total population = 100)
Percentage of foreigners seeking asylum: well above average percentage in East German territorial areas, with a lower percentage of foreigners
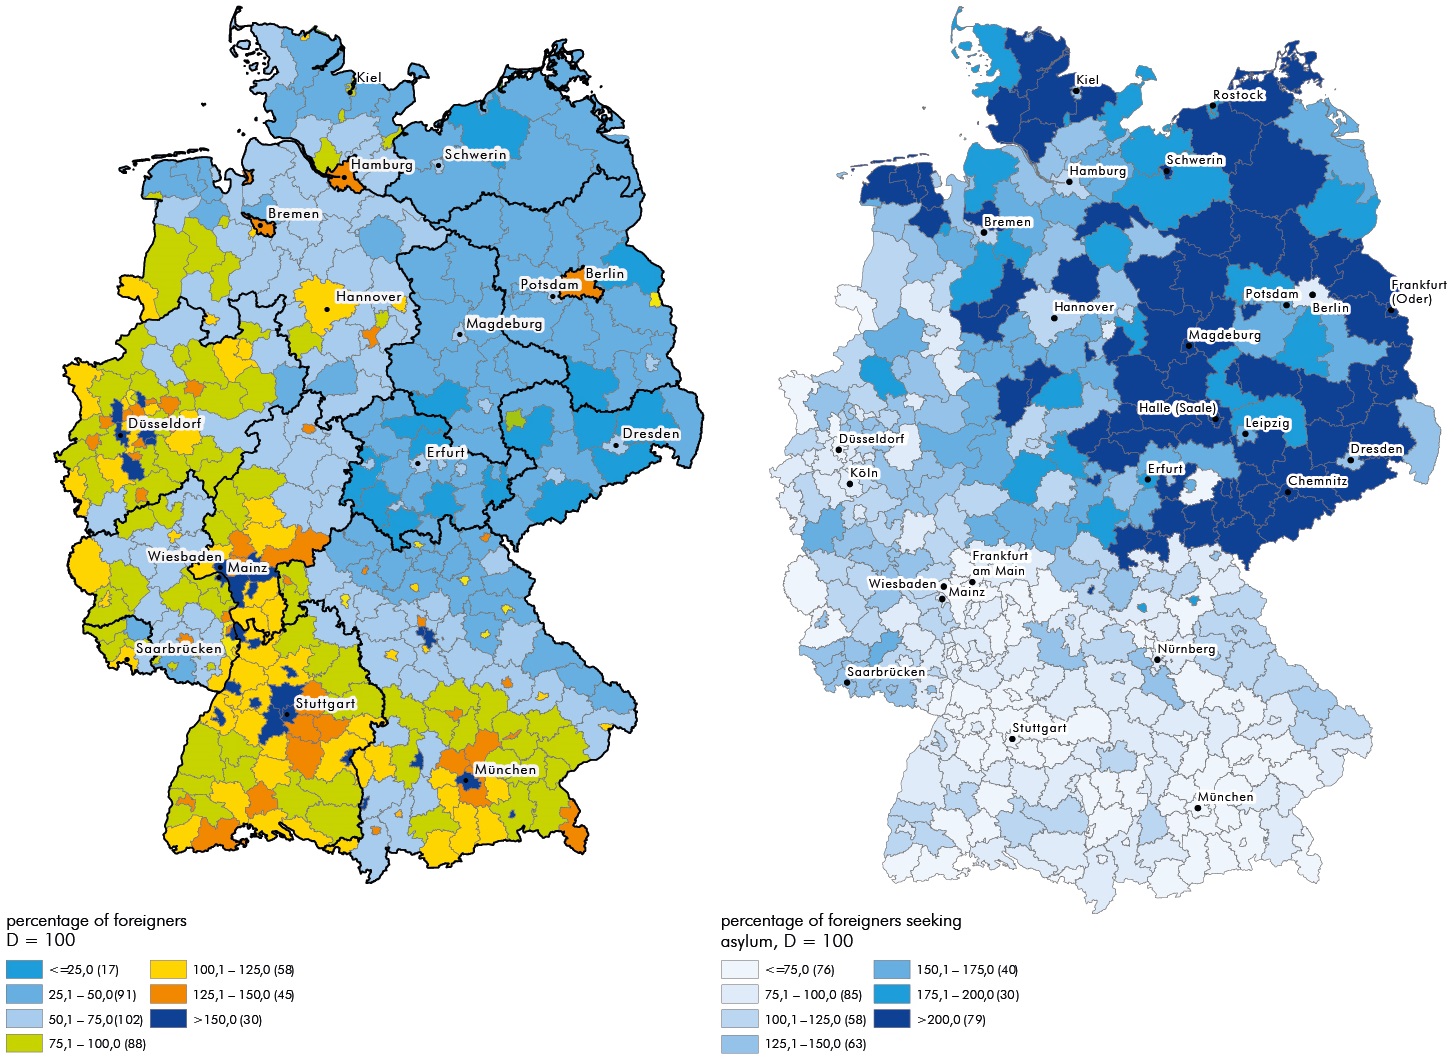
31.12.2016
Specialist staff vacancies: a growing problem in East and West German companies
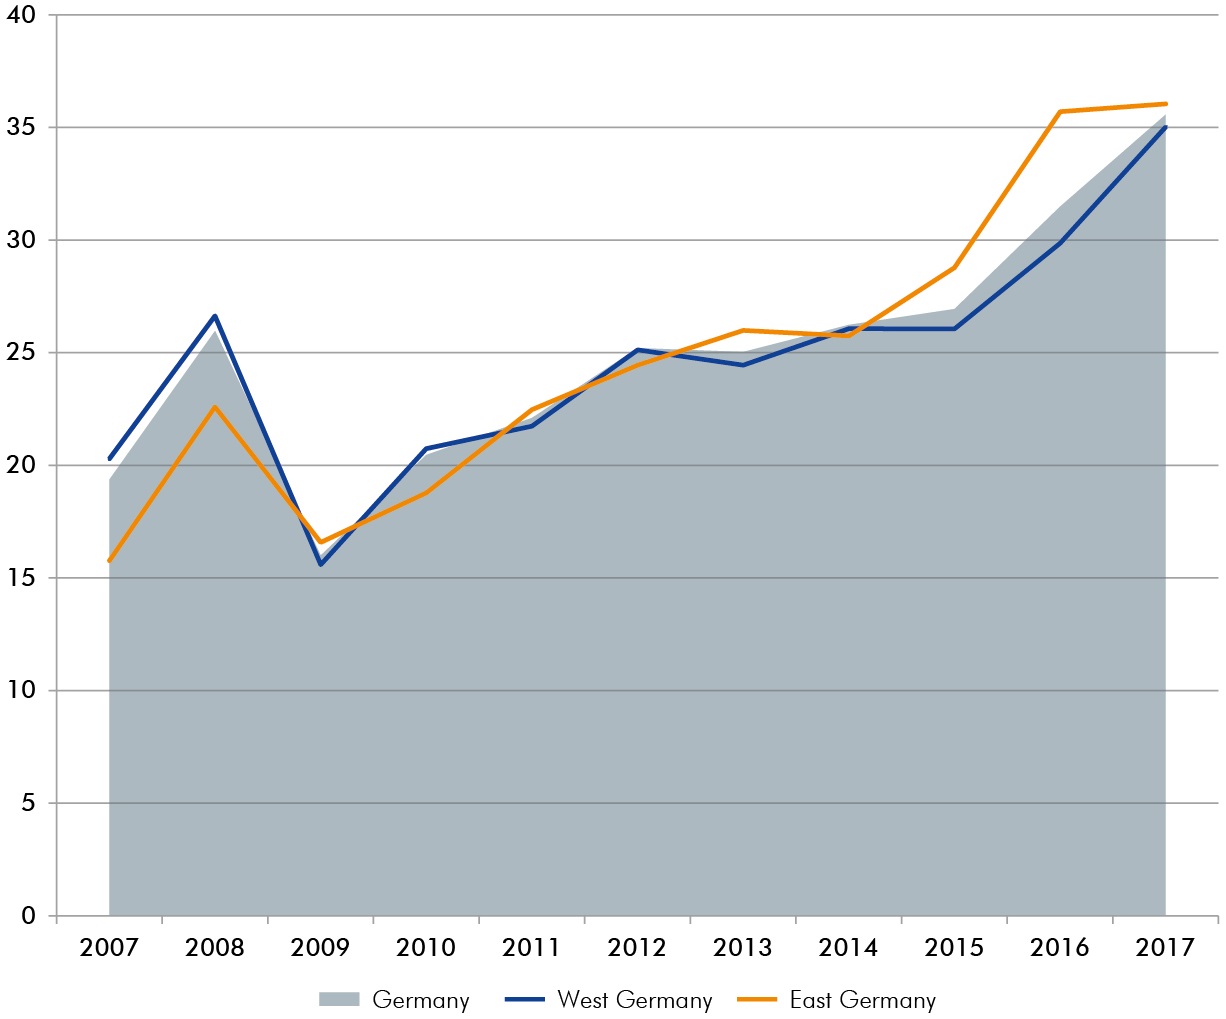
Vacancies, 2007 to 2017, in %
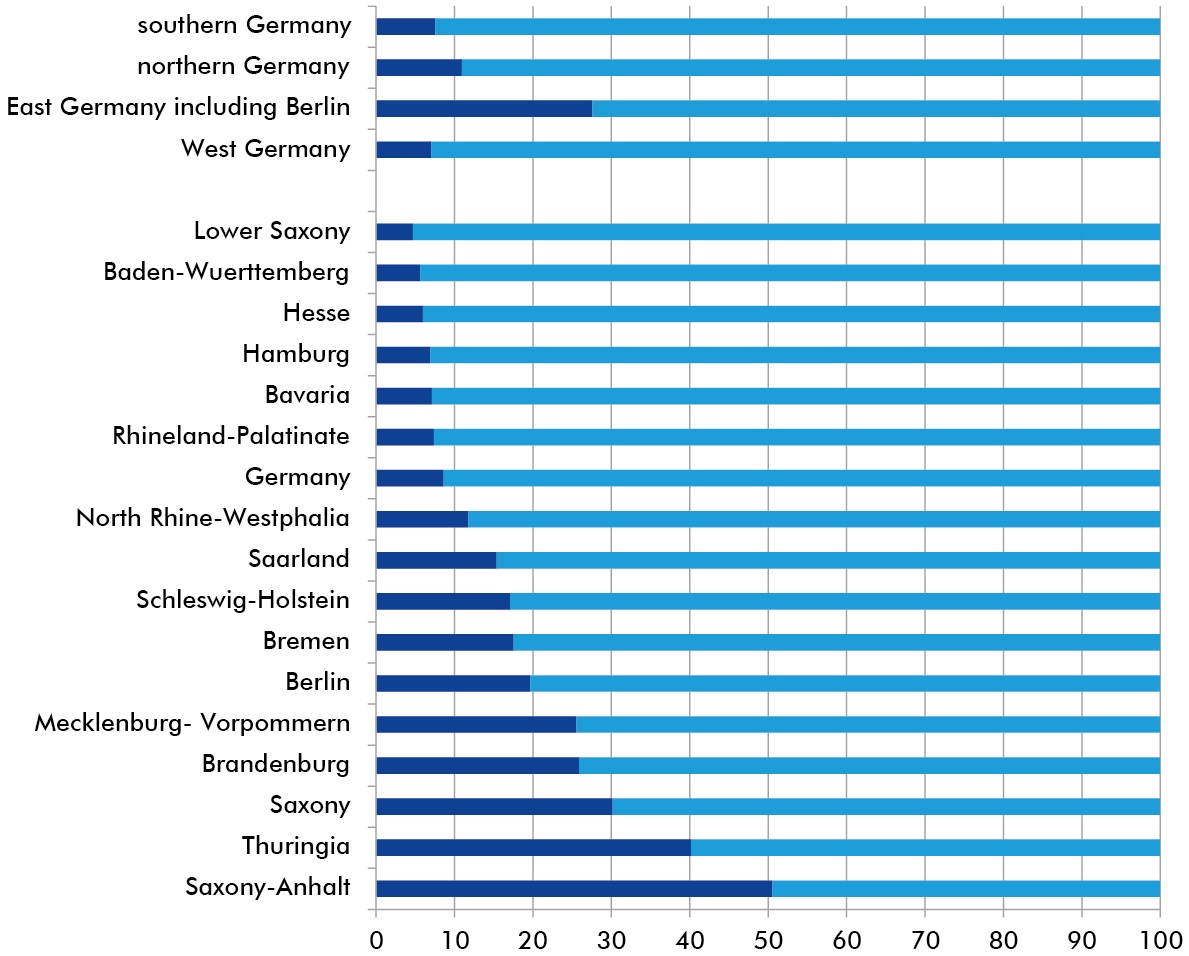
Part-time work: lower proportion of part-time staff in East Germany
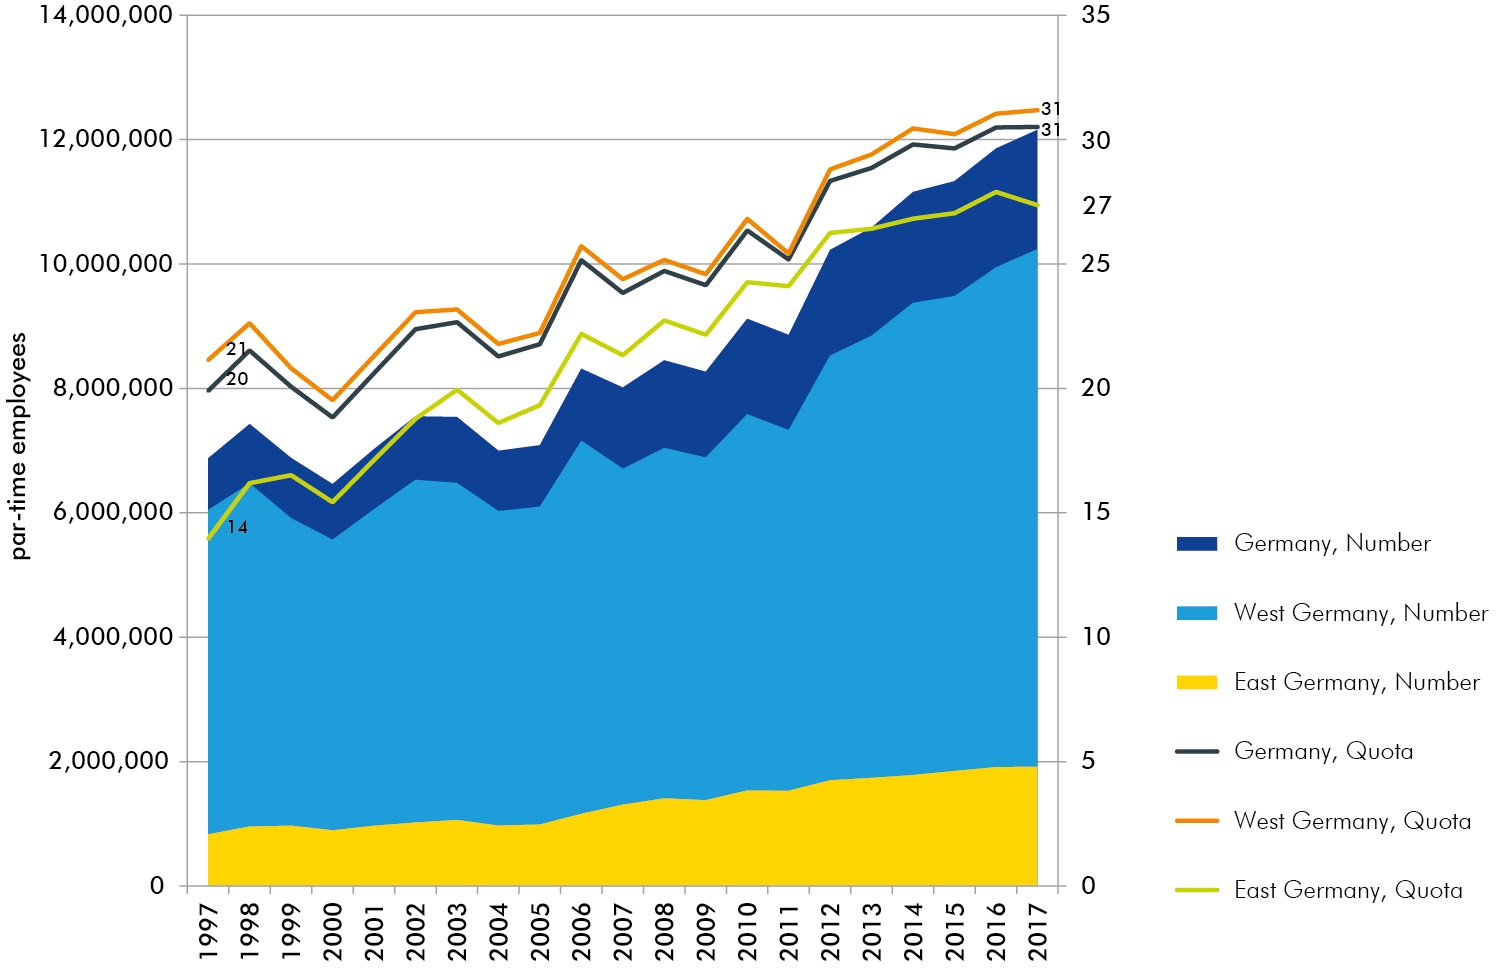
Part-time employment and share of part-time employment in total employment, 1997 to 2017
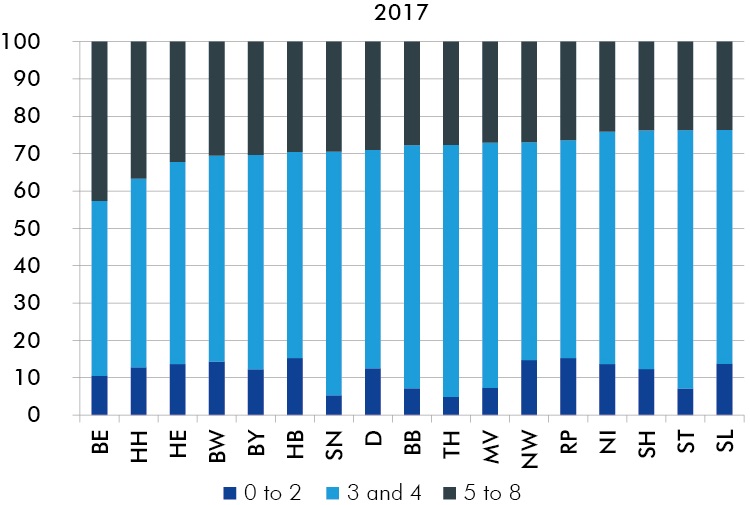
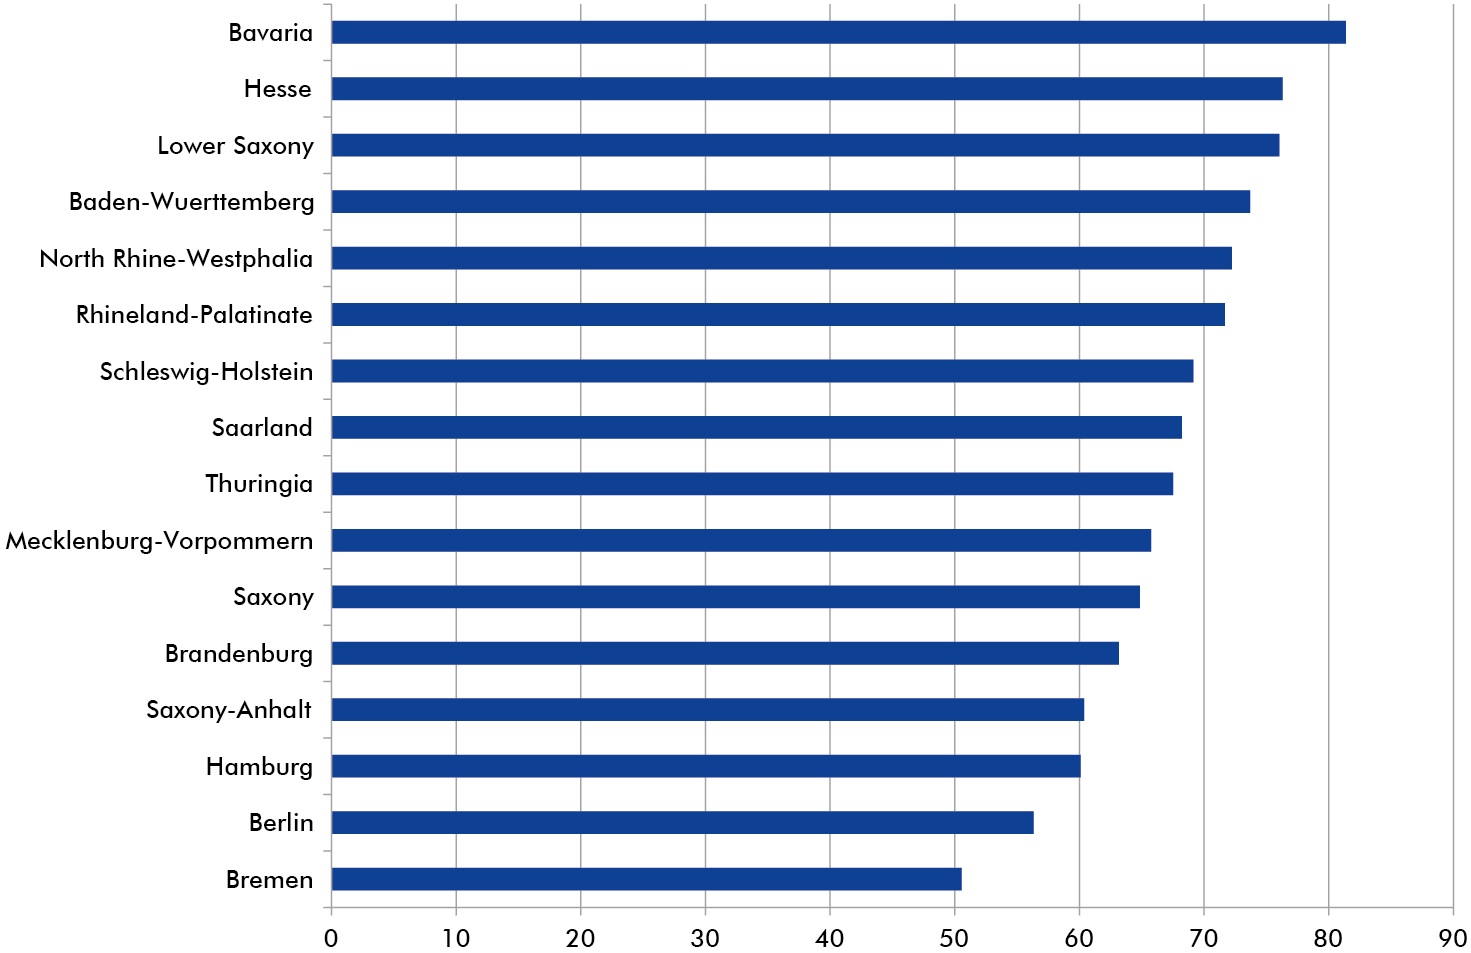
Tertiary education is falling behind in East German territorial areas
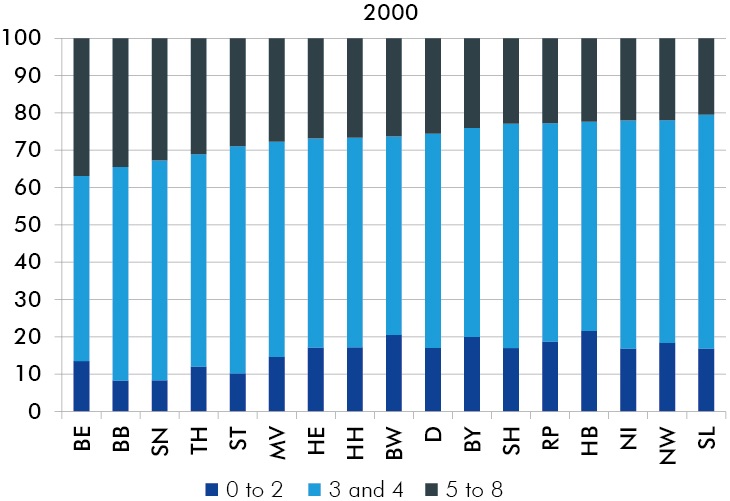
Employment in the federal states by education level, ranked by the share of employees with tertiary education
Tertiary education is falling behind in East German territorial areas
Employment in the federal states by education level, ranked by the share of employees with tertiary education
Large regional differences in school drop-outs
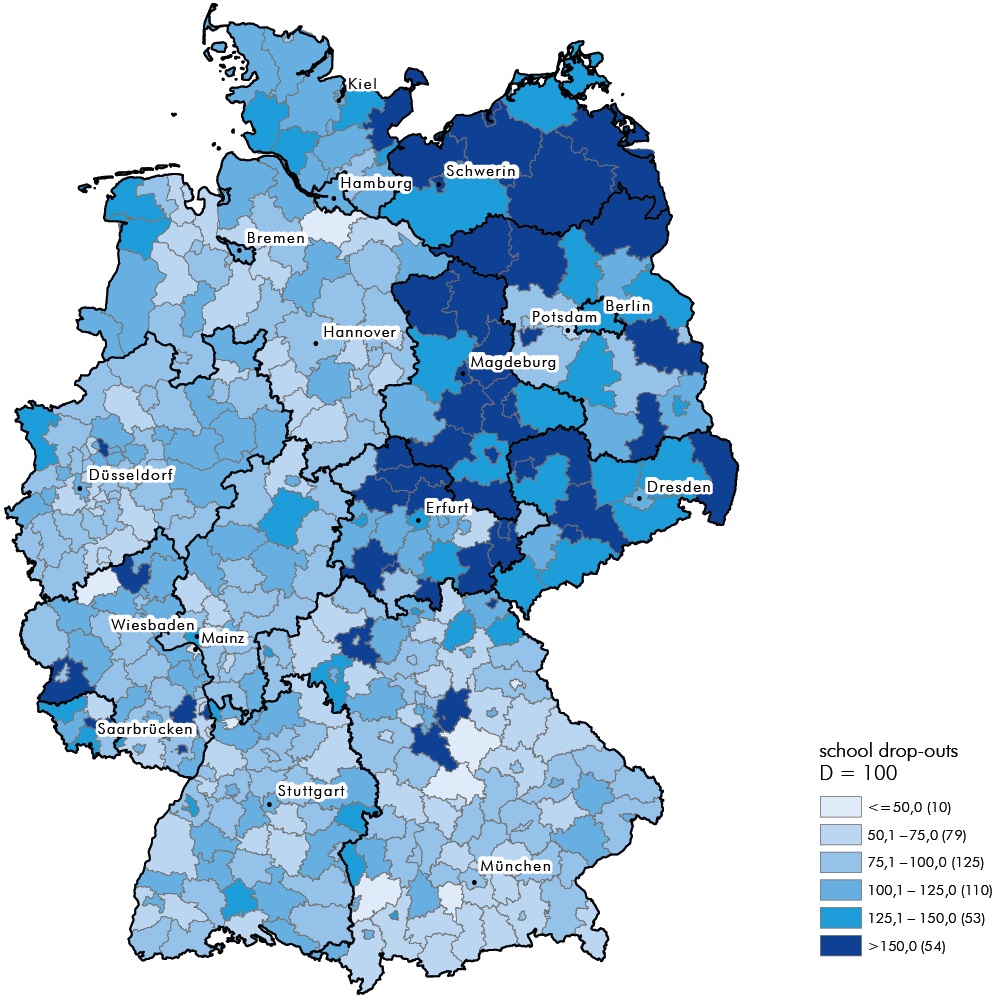
Early school leavers: share of school leavers who do not possess a Certificate of Secondary Education in the total number of school leavers in 2016, Germany = 100
In East Germany and structurally weak West German states, SMEs make an above-average contribution to the economy‘s research and development spending
Internal R&D expenditures in the corporate sector by employment size of firms 2015, in % (total expenditures per state or region = 100)
Baden-Wuerttemberg, Berlin, Lower Saxony and Bavaria spend above-average amounts on research and development
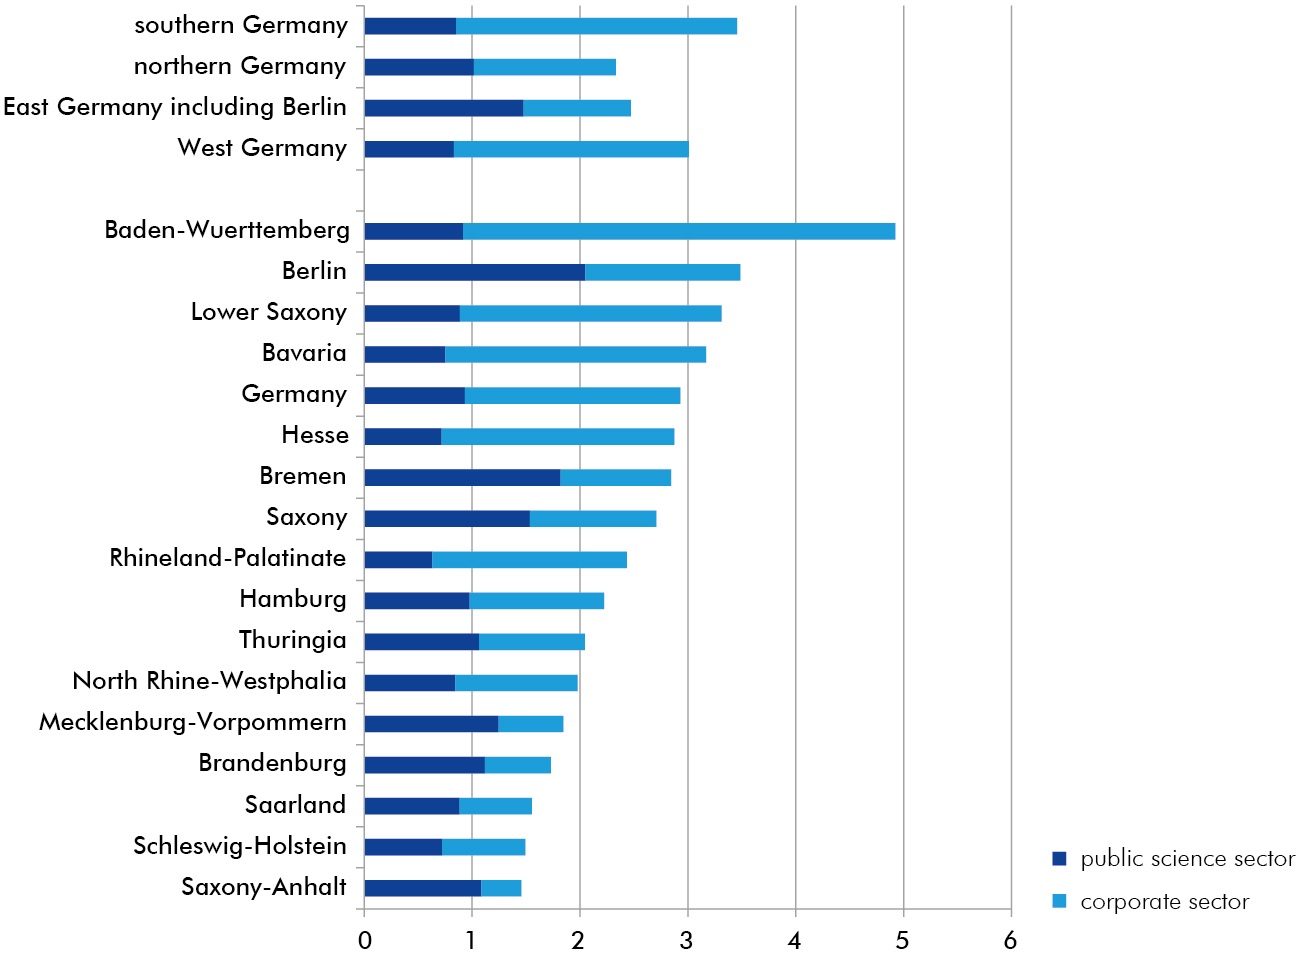
Share of internal R&D expenditures 2016 in gross domestic product by federal states and regions, current prices, in %
Excellence clusters: East German territorial areas underrepresented in cutting-edge research, with the exception of Saxony
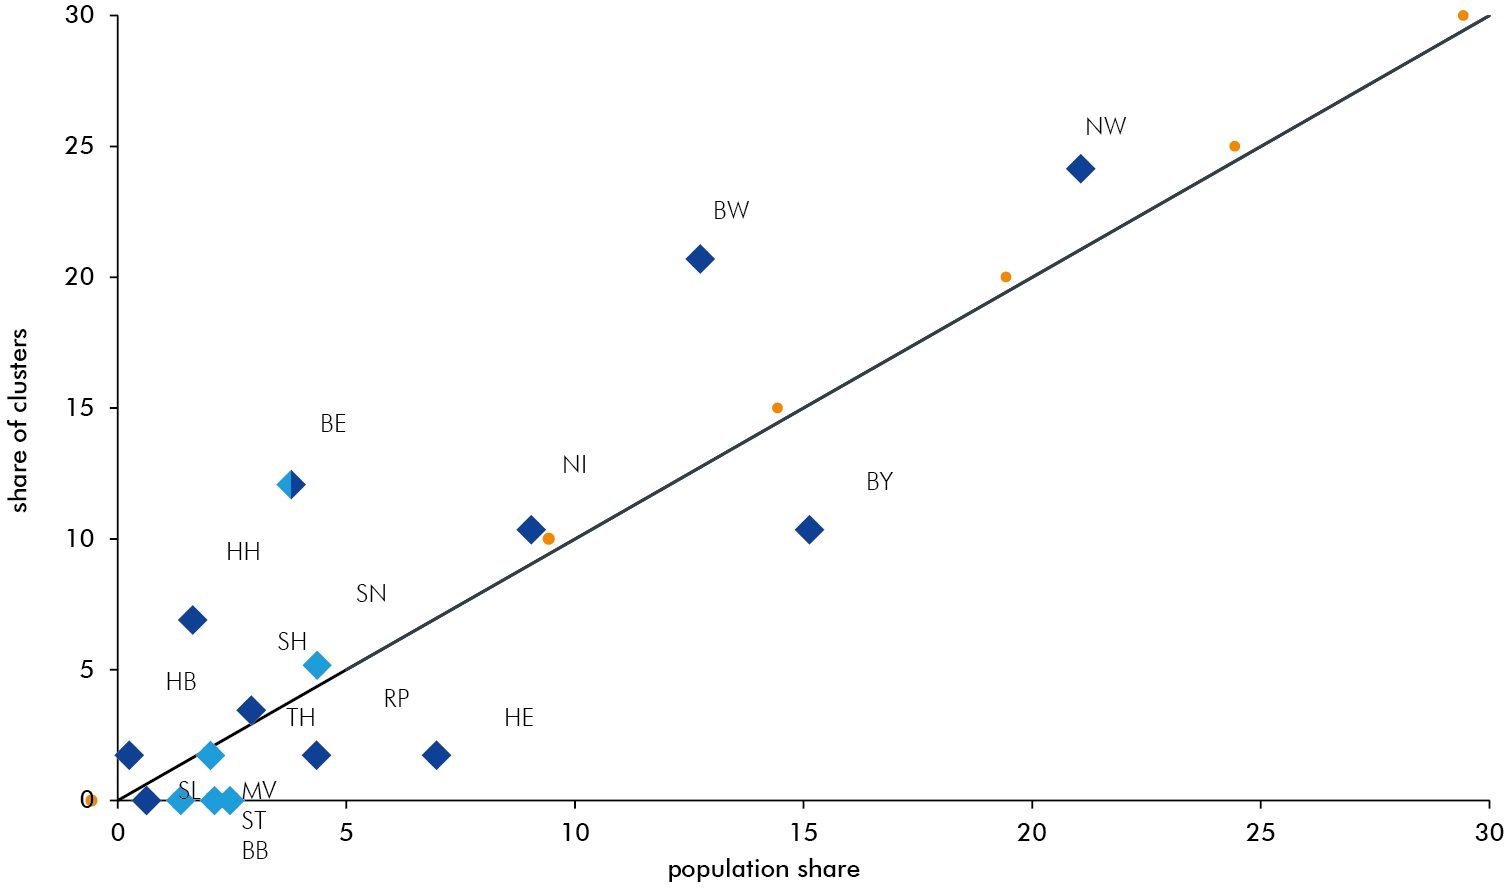
Share of the federal states in the 57 excellence clusters of German universities in relation to the share in total population in Germany, in %
In industry, companies of below-average size tend to be associated with lower export rates
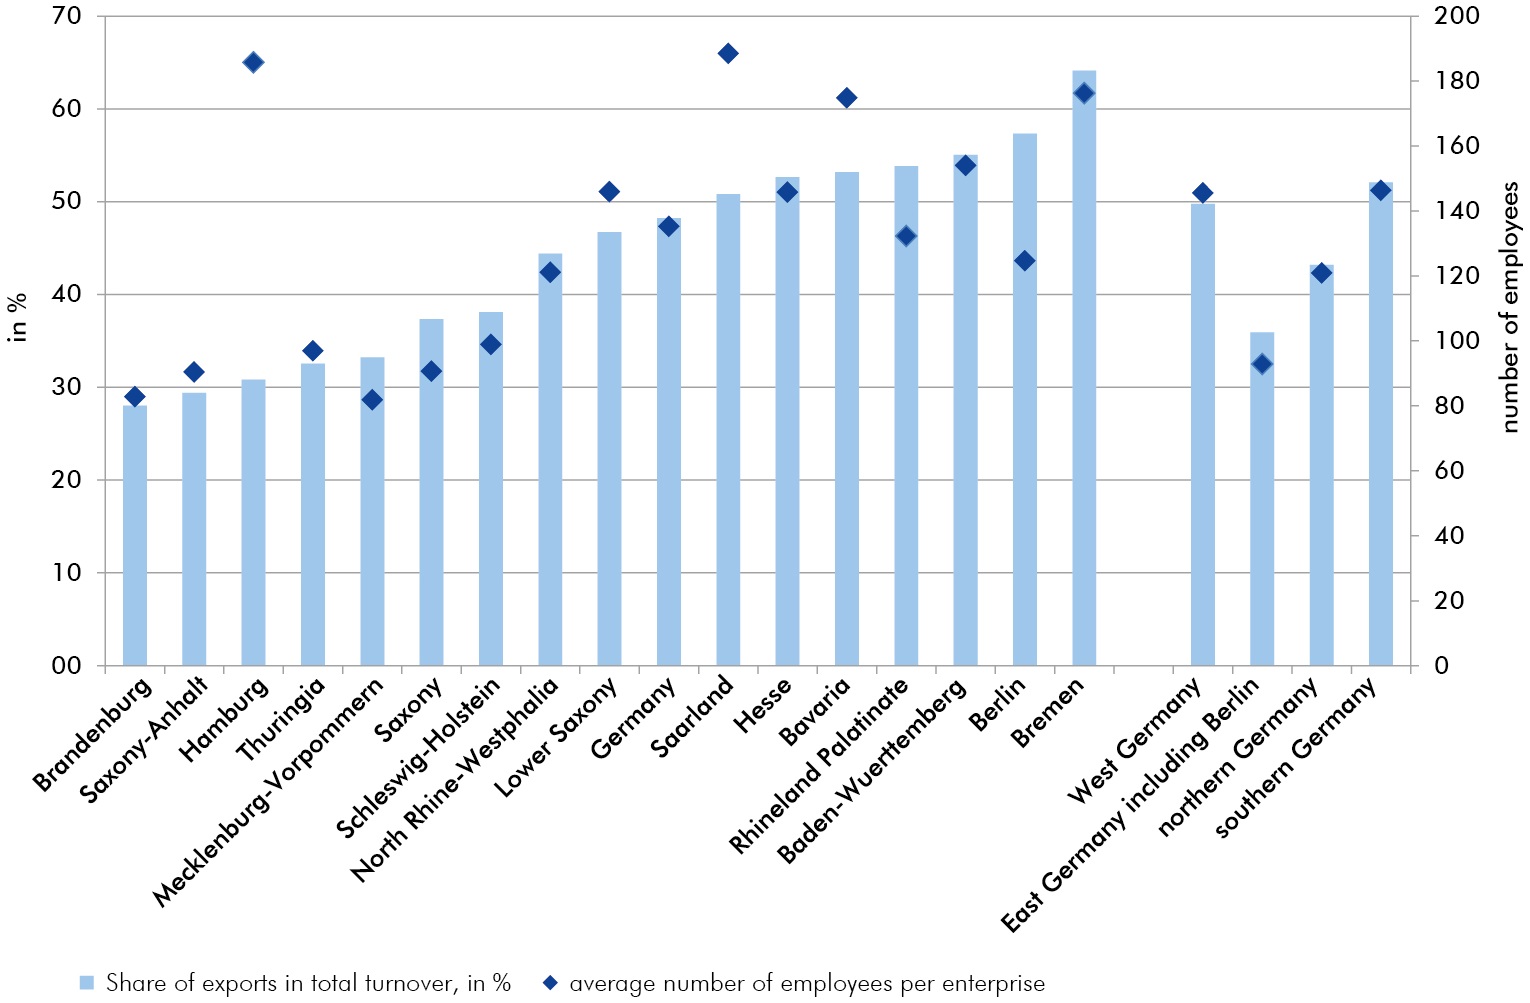
Employees per enterprise, share of exports in total turnover, 2017, enterprises belonging to firms of the manufacturing sector, mining and quarrying of 20 and more employees
East Germany‘s transfer dependency has fallen, but still exists
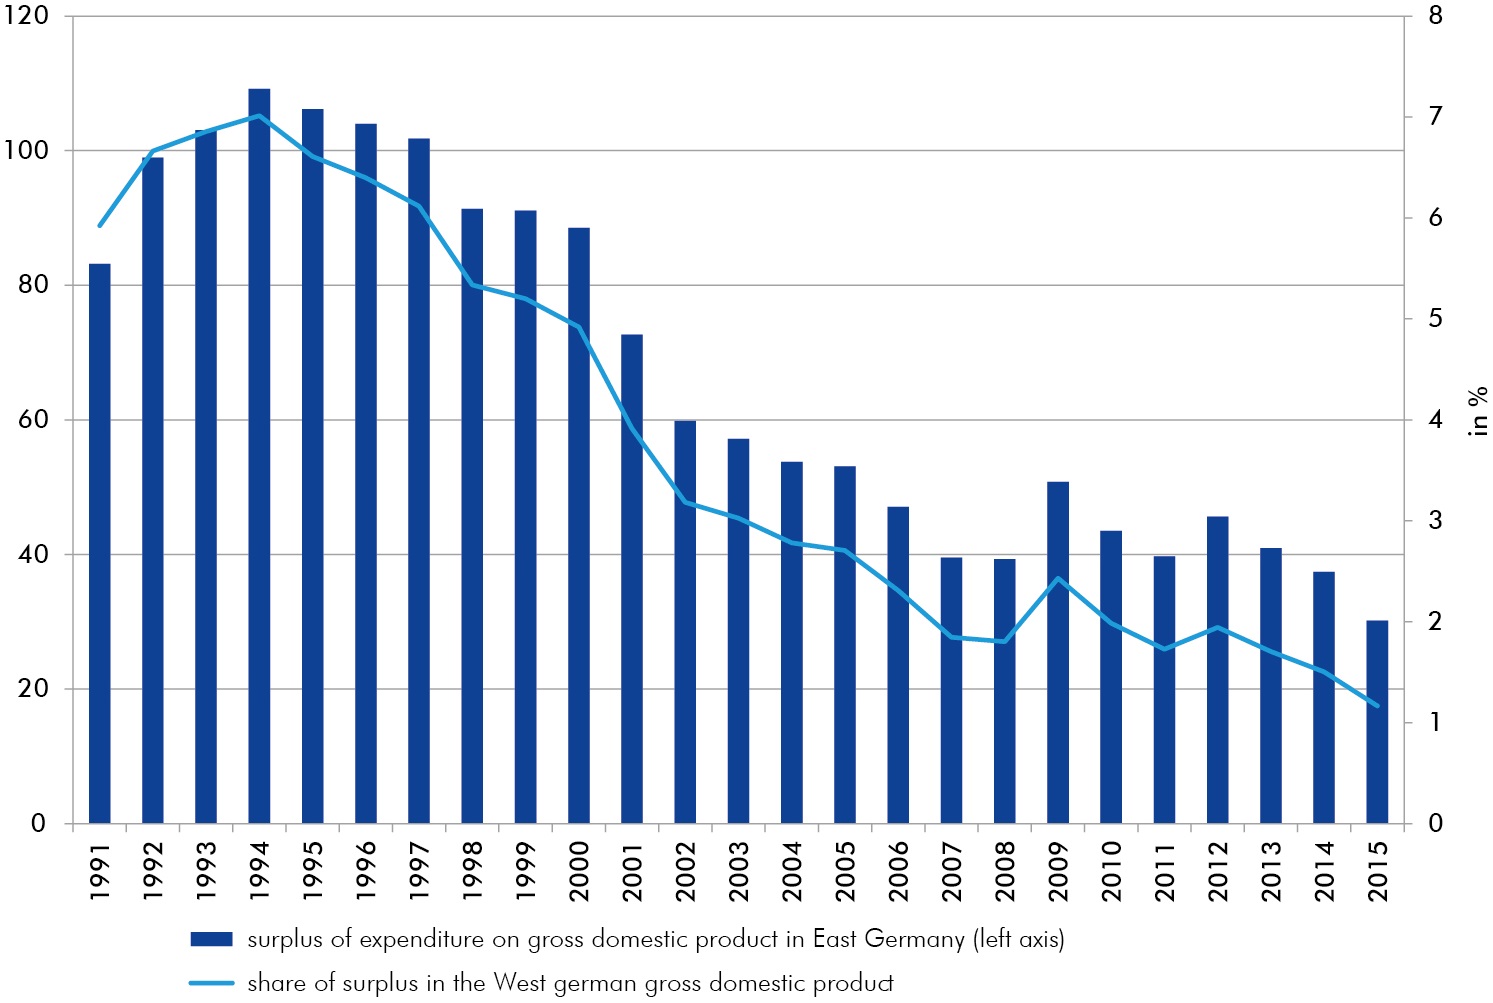
Gap between expenditure and gross domestic product in East Germany including Berlin, absolute volume and relative to the GDP in West Germany
2017 tax coverage ratio: still an east-west divide
Tax revenues as a percentage of adjusted expenditures, in %
Not all municipalities anticipate demographic change in their investment decisions
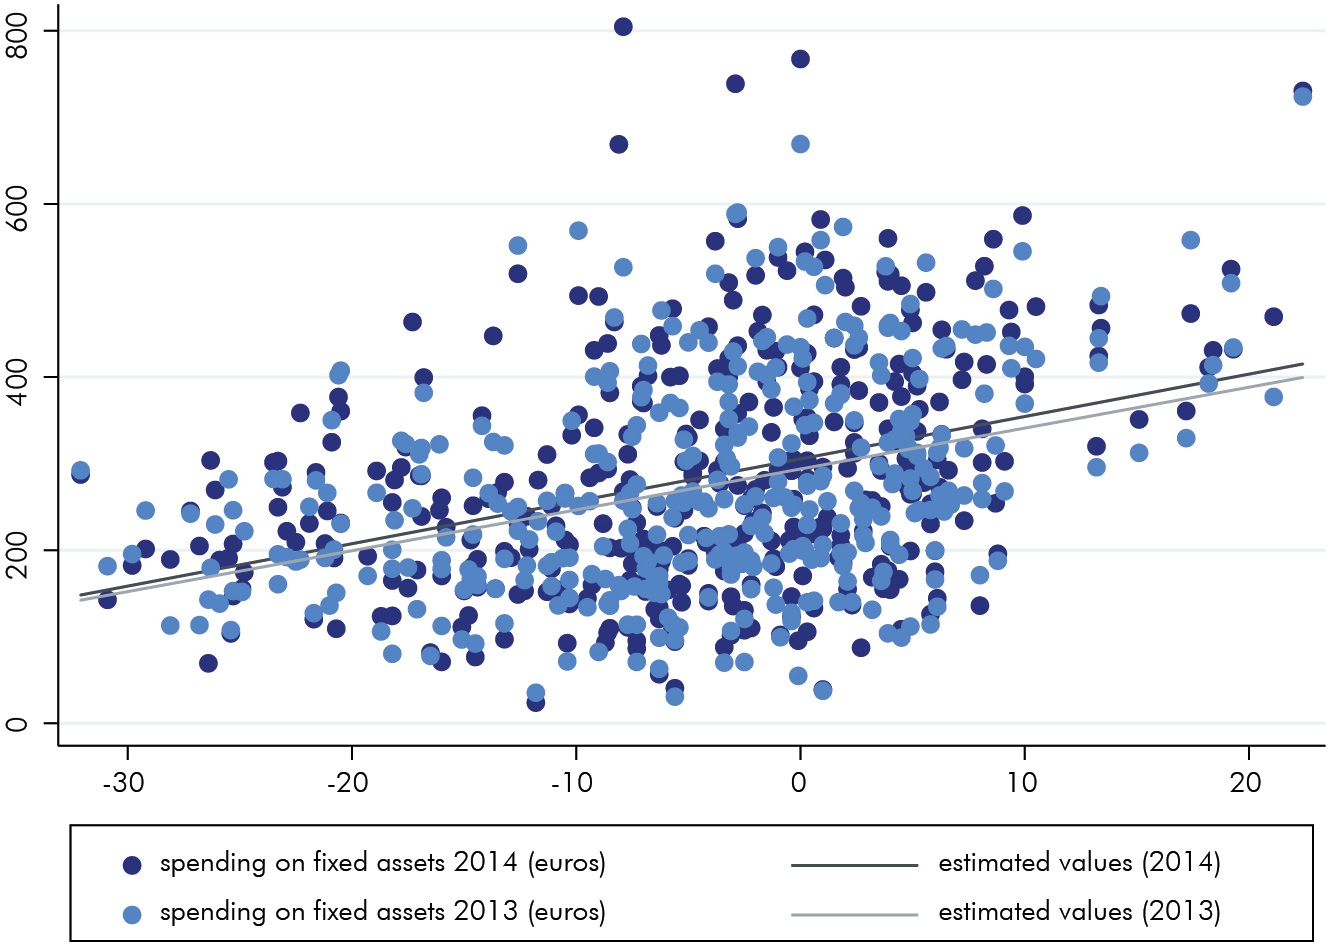
Distribution of municipal investment in fixed assets per resident in Euro for the years 2013 and 2014